是否有适用于 Python 的 SciPy 函数、NumPy 函数或模块可以计算给定特定窗口的一维数组的滑动平均值?
移动平均或滑动平均
298
- Shejo284
2
1请注意,如果您在线构建数组,则问题陈述实际上变成了“如何最有效地维护一个向量,在末尾添加值并在开头弹出值”,因为您可以简单地维护一个平均值的单个累加器,每次输入一个值时添加新值并减去最旧的值,这在复杂度上是微不足道的。 - BjornW
以下除一条外,所有答案都没有回答问题:如何在添加新值时更新移动平均数,即“running”。我建议使用循环缓冲区,这样您就不必经常调整其大小,并且通过计算下一个平均值并了解上一个平均值和新值,可以更新下一个索引(模缓冲区大小)。简单的代数重排即可实现。 - D Left Adjoint to U
30个回答
9
我还没有检查这个的速度有多快,但你可以尝试一下:
from collections import deque

cache = deque() # keep track of seen values
n = 10          # window size
A = xrange(100) # some dummy iterable
cum_sum = 0     # initialize cumulative sum

for t, val in enumerate(A, 1):
    cache.append(val)
    cum_sum += val
    if t < n:
        avg = cum_sum / float(t)
    else:                           # if window is saturated,
        cum_sum -= cache.popleft()  # subtract oldest value
        avg = cum_sum / float(n)
- Kris
2
2这就是我要做的事情。请问有人能够批评一下为什么这种方式不好吗? - staggart
1这个简单的 Python 解决方案对我很有效,而且不需要使用 numpy。最后我将其封装成一个类以供重复使用。 - Matthew Tschiegg
8
与其使用numpy或scipy,我建议使用pandas来更快地完成这项任务:
df['data'].rolling(3).mean()
这将计算“data”列的3个周期的移动平均值(MA)。您还可以计算移位版本,例如排除当前单元格的版本(向后移动一个)可以轻松计算如下:
df['data'].shift(periods=1).rolling(3).mean()
- Gursel Karacor
3
32016年提出的解决方案使用了
pandas.rolling_mean,而我的解决方案使用了pandas.DataFrame.rolling。你也可以很容易地用这种方法计算移动的min()、max()、sum()等,以及mean()。 - Gursel Karacor在前者中,你需要使用不同的方法,比如
pandas.rolling_min,pandas.rolling_max 等。它们相似但又不同。 - Gursel Karacor7
有点晚了,但我已经制作了自己的小函数,它不会在两端进行包裹或用于查找平均值时填充零。更进一步的是,它还会在线性间隔点重新采样信号。您可以根据需要自定义代码以获得其他功能。
该方法是使用标准化高斯内核进行简单的矩阵乘法。
该方法是使用标准化高斯内核进行简单的矩阵乘法。
def running_mean(y_in, x_in, N_out=101, sigma=1):
    '''
    Returns running mean as a Bell-curve weighted average at evenly spaced
    points. Does NOT wrap signal around, or pad with zeros.

    Arguments:
    y_in -- y values, the values to be smoothed and re-sampled
    x_in -- x values for array

    Keyword arguments:
    N_out -- NoOf elements in resampled array.
    sigma -- 'Width' of Bell-curve in units of param x .
    '''
    import numpy as np
    N_in = len(y_in)

    # Gaussian kernel
    x_out = np.linspace(np.min(x_in), np.max(x_in), N_out)
    x_in_mesh, x_out_mesh = np.meshgrid(x_in, x_out)
    gauss_kernel = np.exp(-np.square(x_in_mesh - x_out_mesh) / (2 * sigma**2))
    # Normalize kernel, such that the sum is one along axis 1
    normalization = np.tile(np.reshape(np.sum(gauss_kernel, axis=1), (N_out, 1)), (1, N_in))
    gauss_kernel_normalized = gauss_kernel / normalization
    # Perform running average as a linear operation
    y_out = gauss_kernel_normalized @ y_in

    return y_out, x_out
一个带有正态分布噪声的正弦信号的简单用法:
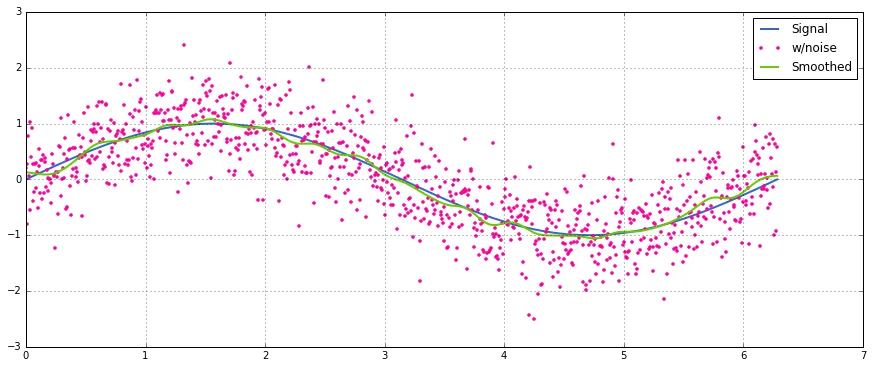
- Clausen
5
这对我不起作用(Python 3.6)。
- 没有名为“sum”的函数,使用“np.sum”代替。
- “@”运算符(不知道是什么)会抛出错误。
这真的是一个运行平均值,还是只是一种平滑方法?函数“size”未定义;应该是len。 - KeithB
1
size和sum应该改为len和np.sum。我已经尝试编辑了这些内容。 - c z@KeithB 一个运行平均值就是一种(非常简单的)平滑方法。使用高斯KDE更复杂,但意味着较远点的权重较小,而不是使用硬窗口。但是,它确实会遵循正态分布的平均值。 - c z
7
Python标准库解决方案
这个生成器函数需要一个可迭代对象和窗口大小N,并在窗口内部的当前值上生成平均值。它使用了一个deque,它是一种类似于列表但针对快速修改(pop,append)两端优化的数据结构。
from collections import deque
from itertools import islice

def sliding_avg(iterable, N):
    it = iter(iterable)
    window = deque(islice(it, N))
    num_vals = len(window)

    if num_vals < N:
        msg = 'window size {} exceeds total number of values {}'
        raise ValueError(msg.format(N, num_vals))

    N = float(N) # force floating point division if using Python 2
    s = sum(window)

    while True:
        yield s/N
        try:
            nxt = next(it)
        except StopIteration:
            break
        s = s - window.popleft() + nxt
        window.append(nxt)
这里是函数的实际运行情况:
>>> values = range(100)
>>> N = 5
>>> window_avg = sliding_avg(values, N)
>>>
>>> next(window_avg) # (0 + 1 + 2 + 3 + 4)/5
>>> 2.0
>>> next(window_avg) # (1 + 2 + 3 + 4 + 5)/5
>>> 3.0
>>> next(window_avg) # (2 + 3 + 4 + 5 + 6)/5
>>> 4.0
- timgeb
6
另一种寻找移动平均值的方法,不需要使用numpy或pandas
import itertools
sample = [2, 6, 10, 8, 11, 10]
list(itertools.starmap(
    lambda a,b: b/a,
    enumerate(itertools.accumulate(sample), 1))
)
将打印出[2.0,4.0,6.0,6.5,7.4,7.833333333333333]
- 2.0 = (2)/1
- 4.0 = (2 + 6) / 2
- 6.0 = (2 + 6 + 10) / 3
- ...
- DmitrySemenov
2
itertools.accumulate 在 Python 2.7 中不存在,但在 Python 3.4 中存在。 - grayaii
如果有人想要一个窗口大小呢? - Intrastellar Explorer
5
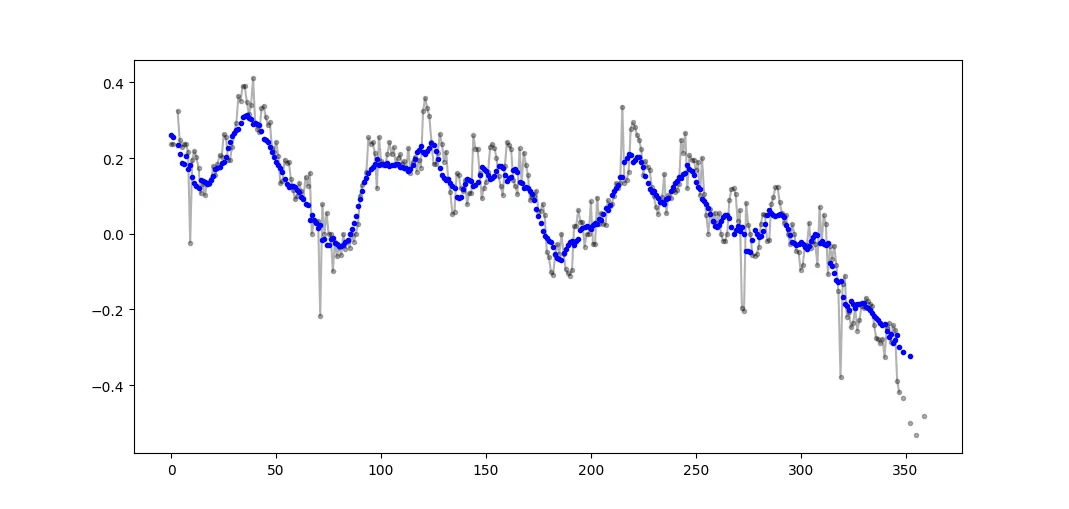
上面有很多关于计算移动平均的答案。我的答案增加了两个额外的功能:
我使用numpy.cumsum因为它是最高效的方法(参见上面Alleo的答案)。
这段代码仅适用于偶数N。通过更改padded_x和n_nan的np.insert,可以调整为奇数。示例输出(原始数据为黑色,移动平均值为蓝色):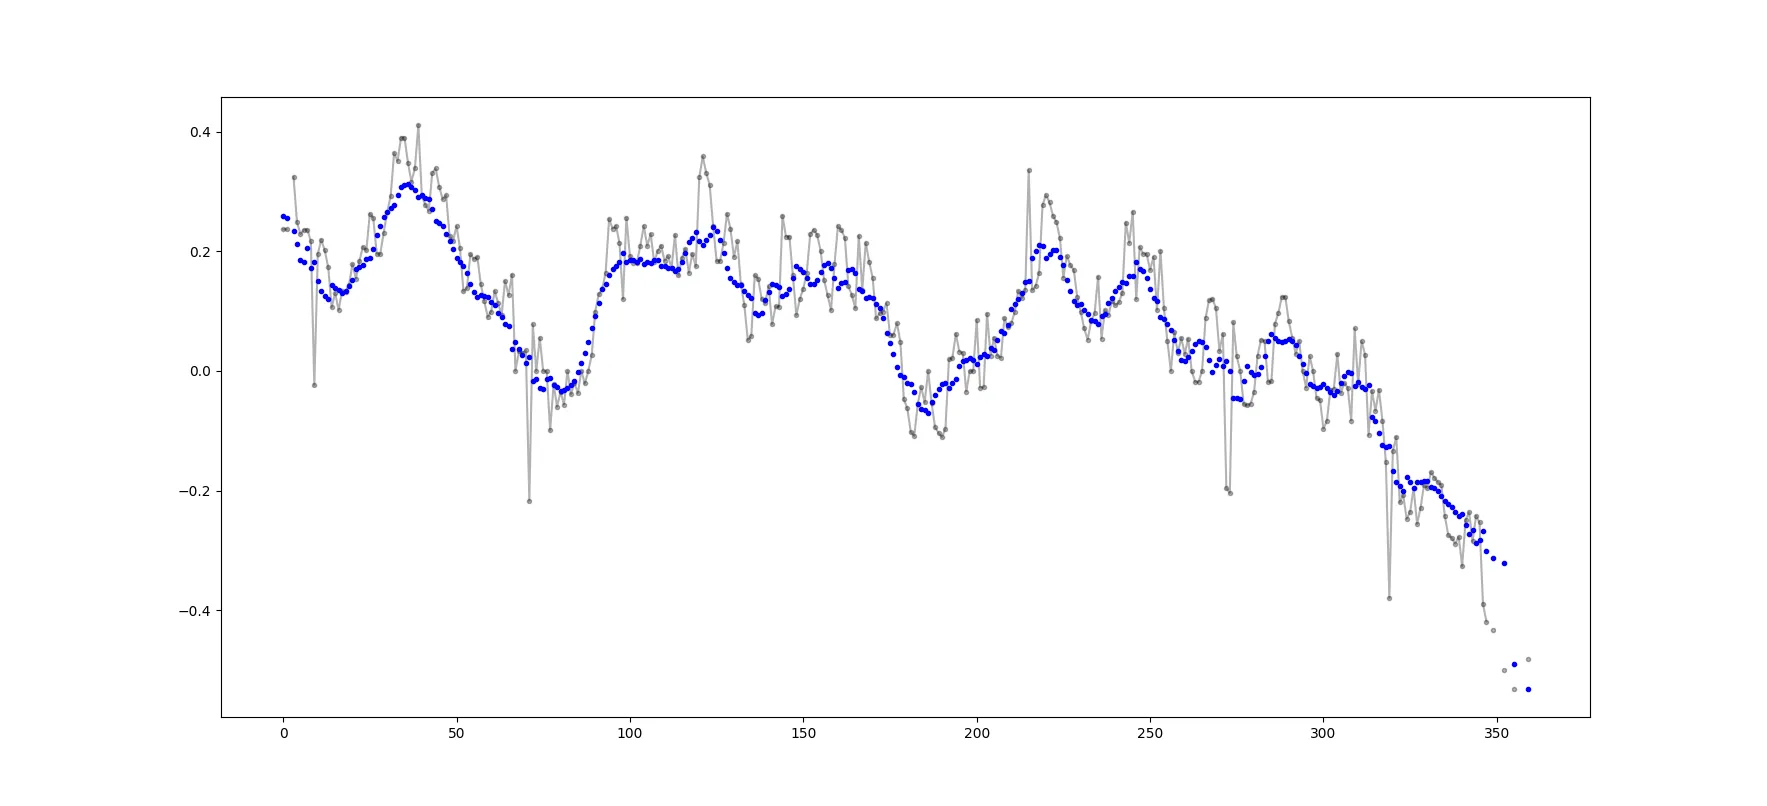 可以轻松地调整此代码,以删除从少于cutoff = 3个非NaN值计算的所有移动平均值。
- 忽略nan值
- 计算N个相邻值的平均值,不包括自身的值。
我使用numpy.cumsum因为它是最高效的方法(参见上面Alleo的答案)。
N=10 # number of points to test on each side of point of interest, best if even
padded_x = np.insert(np.insert( np.insert(x, len(x), np.empty(int(N/2))*np.nan), 0, np.empty(int(N/2))*np.nan ),0,0)
n_nan = np.cumsum(np.isnan(padded_x))
cumsum = np.nancumsum(padded_x)
window_sum = cumsum[N+1:] - cumsum[:-(N+1)] - x # subtract value of interest from sum of all values within window
window_n_nan = n_nan[N+1:] - n_nan[:-(N+1)] - np.isnan(x)
window_n_values = (N - window_n_nan)
movavg = (window_sum) / (window_n_values)
这段代码仅适用于偶数N。通过更改padded_x和n_nan的np.insert,可以调整为奇数。示例输出(原始数据为黑色,移动平均值为蓝色):
可以轻松地调整此代码,以删除从少于cutoff = 3个非NaN值计算的所有移动平均值。window_n_values = (N - window_n_nan).astype(float) # dtype must be float to set some values to nan
cutoff = 3
window_n_values[window_n_values<cutoff] = np.nan
movavg = (window_sum) / (window_n_values)
- gtcoder
5
上面的一个答案中,有一篇由mab评论的内容,其中提到了这个方法。 bottleneck有一个move_mean简单移动平均函数:
import numpy as np
import bottleneck as bn

a = np.arange(10) + np.random.random(10)

mva = bn.move_mean(a, window=2, min_count=1)
min_count 是一个方便的参数,它会将移动平均值计算到数组中该点为止。如果您不设置 min_count,它将等于 window,并且在前 window 个点之前的所有值都将是 NaN。
- wordsforthewise
5
所有上述解决方案都存在问题,因为它们缺乏以下特点:
请注意,
通过 cumsum,您将通过另外添加
这将持续进行,直到达到
这个解决方案是向量化的,
- 速度较慢,因为它们采用的是Python本地代码而非numpy向量化实现。
- 数值稳定性差,因为它们对
numpy.cumsum的使用不当。 - 速度较慢,因为它们采用的是卷积的
O(len(x) * w)实现方法。
import numpy
m = 10000
x = numpy.random.rand(m)
w = 1000
请注意,
x_[:w].sum() 等于 x[:w-1].sum()。因此,在第一个平均值中,numpy.cumsum(...) 通过 x_[w+1] / w 添加 x[w] / w,并从 x_[0] / w 中减去 0。这将导致 x[0:w].mean()。通过 cumsum,您将通过另外添加
x[w+1] / w 并减去 x[0] / w 来更新第二个平均值,从而得到 x[1:w+1].mean()。这将持续进行,直到达到
x[-w:].mean()。x_ = numpy.insert(x, 0, 0)
sliding_average = x_[:w].sum() / w + numpy.cumsum(x_[w:] - x_[:-w]) / w
这个解决方案是向量化的,
O(m),易读且数值稳定。- Herbert
2
不错的解决方案。我会尝试使用掩码来调整它,以便处理原始数据中的
nan,并且仅当当前窗口包含 nan 时,在滑动平均值中放置 nan。不幸的是,使用 np.cumsum 会使第一个遇到的 nan "污染" 掉其余的计算。 - Guimoute我会创建两个版本的信号,一个将nan替换为零,另一个使用np.isnan。在两者上应用滑动窗口,然后在第一个结果中用nan替换那些第二个结果> 0的位置。 - Herbert
5
使用 @Aikude 的变量,我写了一行代码。
import numpy as np

mylist = [1, 2, 3, 4, 5, 6, 7]
N = 3

mean = [np.mean(mylist[x:x+N]) for x in range(len(mylist)-N+1)]
print(mean)

>>> [2.0, 3.0, 4.0, 5.0, 6.0]
- greentec
4
A new "convolve"配方已经合并到Python 3.10中。
给定:
给定:
import collections, operator

from itertools import chain, repeat


size = 3 + 1
kernel = [1/size] * size
代码
def convolve(signal, kernel):
    # See:  https://betterexplained.com/articles/intuitive-convolution/
    # convolve(data, [0.25, 0.25, 0.25, 0.25]) --> Moving average (blur)
    # convolve(data, [1, -1]) --> 1st finite difference (1st derivative)
    # convolve(data, [1, -2, 1]) --> 2nd finite difference (2nd derivative)
    kernel = list(reversed(kernel))
    n = len(kernel)
    window = collections.deque([0] * n, maxlen=n)
    for x in chain(signal, repeat(0, n-1)):
        window.append(x)
        yield sum(map(operator.mul, kernel, window))
演示
list(convolve(range(1, 6), kernel))
# [0.25, 0.75, 1.5, 2.5, 3.5, 3.0, 2.25, 1.25]
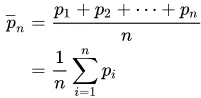
细节
卷积是一种通用的数学运算,可以应用于移动平均值。其思想是,给定一些数据,您将数据的子集(窗口)作为“掩模”或“核”滑动到数据上,对每个窗口执行特定的数学运算。在移动平均值的情况下,核是平均值:
more_itertools.convolve 使用这个实现。
more_itertools 是一个受欢迎的第三方包;通过 > pip install more_itertools 安装。- pylang
网页内容由stack overflow 提供, 点击上面的可以查看英文原文,
原文链接
原文链接