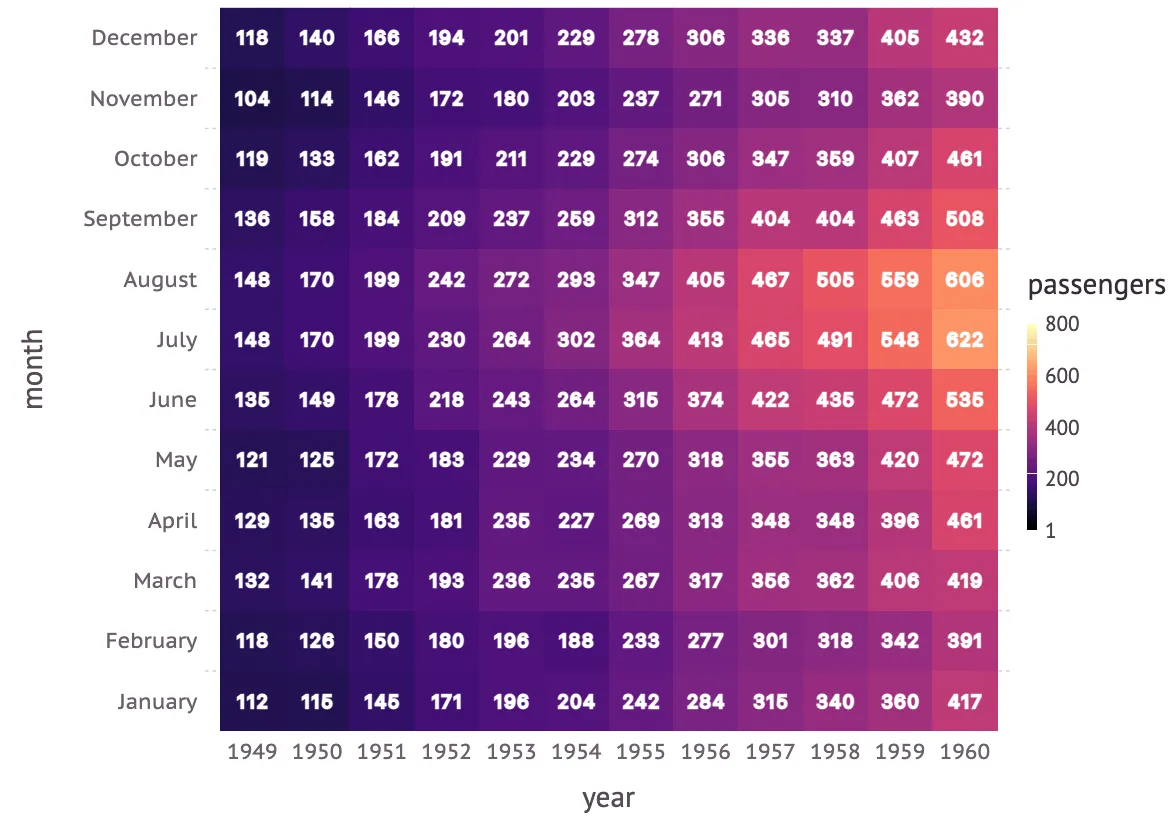
我来自Python,正在尝试使用Gadfly软件包在Julia中复制这个Seaborn图。我有两个问题:
- 如何注释此热图以显示每个单元格的实际值,而不会“重复”代码行?
- 如何修改xticks以显示1949年到1960年的所有年份值?
我的代码:
using DataFrames
using CSV
using Gadfly
using Compose
using ColorSchemes

download("https://raw.githubusercontent.com/mwaskom/seaborn-data/master/flights.csv", "flights.csv");
flights = DataFrame(CSV.File("flights.csv"))
flights_unstacked = unstack(flights, :month, :year, :passengers)

set_default_plot_size(16cm, 12cm)

plot(
    flights,
    x=:year,
    y=:month,
    color=:passengers,
    Geom.rectbin,
    Scale.ContinuousColorScale(palette -> get(ColorSchemes.magma, palette)),
    Guide.xticks(ticks=[minimum(flights.year):maximum(flights.year);]),
    Theme(background_color = "white"),

    Guide.annotation(compose(context(), text(fill(1949, 12), 1:12, string.(flights_unstacked[:, "1949"]), [hcenter], [vcenter]), fontsize(7pt), stroke("white"))),
    Guide.annotation(compose(context(), text(fill(1950, 12), 1:12, string.(flights_unstacked[:, "1950"]), [hcenter], [vcenter]), fontsize(7pt), stroke("white"))),
    Guide.annotation(compose(context(), text(fill(1951, 12), 1:12, string.(flights_unstacked[:, "1951"]), [hcenter], [vcenter]), fontsize(7pt), stroke("white"))),
    Guide.annotation(compose(context(), text(fill(1952, 12), 1:12, string.(flights_unstacked[:, "1952"]), [hcenter], [vcenter]), fontsize(7pt), stroke("white"))),
    Guide.annotation(compose(context(), text(fill(1953, 12), 1:12, string.(flights_unstacked[:, "1953"]), [hcenter], [vcenter]), fontsize(7pt), stroke("white"))),
    Guide.annotation(compose(context(), text(fill(1954, 12), 1:12, string.(flights_unstacked[:, "1954"]), [hcenter], [vcenter]), fontsize(7pt), stroke("white"))),
    Guide.annotation(compose(context(), text(fill(1955, 12), 1:12, string.(flights_unstacked[:, "1955"]), [hcenter], [vcenter]), fontsize(7pt), stroke("white"))),
    Guide.annotation(compose(context(), text(fill(1956, 12), 1:12, string.(flights_unstacked[:, "1956"]), [hcenter], [vcenter]), fontsize(7pt), stroke("white"))),
    Guide.annotation(compose(context(), text(fill(1957, 12), 1:12, string.(flights_unstacked[:, "1957"]), [hcenter], [vcenter]), fontsize(7pt), stroke("white"))),
    Guide.annotation(compose(context(), text(fill(1958, 12), 1:12, string.(flights_unstacked[:, "1958"]), [hcenter], [vcenter]), fontsize(7pt), stroke("white"))),
    Guide.annotation(compose(context(), text(fill(1959, 12), 1:12, string.(flights_unstacked[:, "1959"]), [hcenter], [vcenter]), fontsize(7pt), stroke("white"))),
    Guide.annotation(compose(context(), text(fill(1960, 12), 1:12, string.(flights_unstacked[:, "1960"]), [hcenter], [vcenter]), fontsize(7pt), stroke("white"))),
    )