我正在使用Python中的Seaborn创建热图。我可以使用传入的值注释单元格,但我想添加表示单元格含义的注释。例如,我想看到相应的标签,而不仅仅是看到
在Seaborn文档中,热图函数的参数有点晦涩,我认为这里的关键是:
我尝试将
以下是我的代码(我在此手动创建数据数组以便重现):
0.000000,比如"Foo"或0.000000 (Foo)。在Seaborn文档中,热图函数的参数有点晦涩,我认为这里的关键是:
annot_kws : dict of key, value mappings, optional
  Keyword arguments for ax.text when annot is True.
我尝试将
annot_kws设置为一个字典,其中包含别名和值,例如{'Foo':-0.231049060187,'Bar':0.000000}等,但是我收到了一个AttributeError错误。以下是我的代码(我在此手动创建数据数组以便重现):
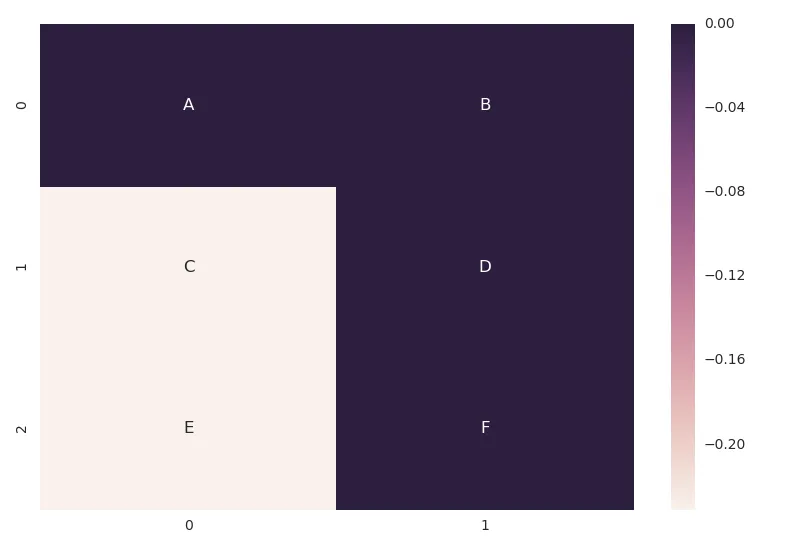
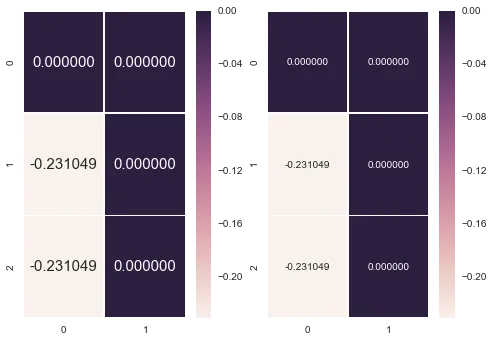
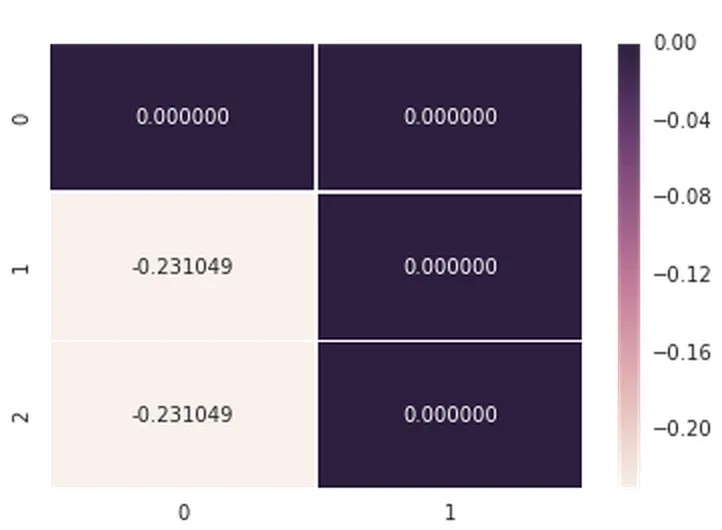
data = np.array([[0.000000,0.000000],[-0.231049,0.000000],[-0.231049,0.000000]])
axs = sns.heatmap(data, vmin=-0.231049, vmax=0, annot=True, fmt='f', linewidths=0.25)
当我不使用annot_kws参数时,这是(工作)输出:
当我包括annot_kws参数时,这里是堆栈跟踪:
---------------------------------------------------------------------------
AttributeError                            Traceback (most recent call last)
<ipython-input-57-38f91f1bb4b8> in <module>()
     12
     13
---> 14 axs = sns.heatmap(data, vmin=min(uv), vmax=max(uv), annot=True, annot_kws=kws, linewidths=0.25)
     15 concepts

/opt/anaconda/2.3.0/lib/python2.7/site-packages/seaborn/matrix.pyc in heatmap(data, vmin, vmax, cmap, center, robust, annot, fmt, annot_kws, linewidths, linecolor, cbar, cbar_kws, cbar_ax, square, ax, xticklabels, yticklabels, mask, **kwargs)
    272     if square:
    273         ax.set_aspect("equal")
--> 274     plotter.plot(ax, cbar_ax, kwargs)
    275     return ax
    276

/opt/anaconda/2.3.0/lib/python2.7/site-packages/seaborn/matrix.pyc in plot(self, ax, cax, kws)
    170         # Annotate the cells with the formatted values
    171         if self.annot:
--> 172             self._annotate_heatmap(ax, mesh)
    173
    174         # Possibly add a colorbar

/opt/anaconda/2.3.0/lib/python2.7/site-packages/seaborn/matrix.pyc in _annotate_heatmap(self, ax, mesh)
    138             val = ("{:" + self.fmt + "}").format(val)
    139             ax.text(x, y, val, color=text_color,
--> 140                     ha="center", va="center", **self.annot_kws)
    141
    142     def plot(self, ax, cax, kws):

/opt/anaconda/2.3.0/lib/python2.7/site-packages/matplotlib/axes/_axes.pyc in text(self, x, y, s, fontdict, withdash, **kwargs)
    590         if fontdict is not None:
    591             t.update(fontdict)
--> 592         t.update(kwargs)
    593         self.texts.append(t)
    594         t._remove_method = lambda h: self.texts.remove(h)

/opt/anaconda/2.3.0/lib/python2.7/site-packages/matplotlib/artist.pyc in update(self, props)
    755             func = getattr(self, 'set_' + k, None)
    756             if func is None or not six.callable(func):
--> 757                 raise AttributeError('Unknown property %s' % k)
    758             func(v)
    759             changed = True

AttributeError: Unknown property tokenized
最后,我在堆栈跟踪中传递的kws属性是字典,大致如下:
kws = {'Foo': -0.231049060187, 'Bar': 0.0}
希望一切都说得通,我会感激任何人能给予的帮助。