如何加速seaborn热力图

3

我在处理使用seaborn facetgrid绘制热力图的速度问题。我的数据集比之前的问题(链接)更大,感谢@Diziet Asahi提供了解决facetgrid问题的方法。

现在,我有一个20x20的网格,每个网格中有625个点需要映射。即使是一个小的图层little1,也需要很长时间才能得到输出结果。在真实数据中,我有成千上万个little图层。

我的代码如下:

import pandas as pd
import numpy as np
import itertools
import seaborn as sns
from matplotlib.colors import ListedColormap

print("seaborn version {}".format(sns.__version__))
# R expand.grid() function in Python
# https://dev59.com/eGct5IYBdhLWcg3wZMfn#12131385
def expandgrid(*itrs):
   product = list(itertools.product(*itrs))
   return {'Var{}'.format(i+1):[x[i] for x in product] for i in range(len(itrs))}

ltt= ['little1']

methods=["m" + str(i) for i in range(1,21)]
labels=["l" + str(i) for i in range(1,20)]

times = range(0,100,4)
data = pd.DataFrame(expandgrid(ltt,methods,labels, times, times))
data.columns = ['ltt','method','labels','dtsi','rtsi']
data['nw_score'] = np.random.choice([0,1],data.shape[0])

data 的输出结果为:

Out[36]: 
            ltt method labels  dtsi  rtsi  nw_score
0       little1     m1     l1     0     0         1
1       little1     m1     l1     0     4         0
2       little1     m1     l1     0     8         0
3       little1     m1     l1     0    12         1
4       little1     m1     l1     0    16         0
        ...    ...    ...   ...   ...       ...
237495  little1    m20    l19    96    80         0
237496  little1    m20    l19    96    84         1
237497  little1    m20    l19    96    88         0
237498  little1    m20    l19    96    92         0
237499  little1    m20    l19    96    96         1

[237500 rows x 6 columns]

绘制和定义 facet 函数:

labels_fill = {0:'red',1:'blue'}

del methods
del labels

def facet(data,color):
    data = data.pivot(index="dtsi", columns='rtsi', values='nw_score')
    g = sns.heatmap(data, cmap=ListedColormap(['red', 'blue']), cbar=False,annot=True)

for lt in data.ltt.unique():
    with sns.plotting_context(font_scale=5.5):
        g = sns.FacetGrid(data[data.ltt==lt],row="labels", col="method", size=2, aspect=1,margin_titles=False)
        g = g.map_dataframe(facet)
        g.add_legend()
        g.set_titles(template="")

        for ax,method in zip(g.axes[0,:],data.method.unique()):
            ax.set_title(method, fontweight='bold', fontsize=12)
        for ax,label in zip(g.axes[:,0],data.labels.unique()):
            ax.set_ylabel(label, fontweight='bold', fontsize=12, rotation=0, ha='right', va='center')
        g.fig.suptitle(lt, fontweight='bold', fontsize=12)
        g.fig.tight_layout()
        g.fig.subplots_adjust(top=0.8) # make some room for the title

        g.savefig(lt+'.png', dpi=300)
    

enter image description here

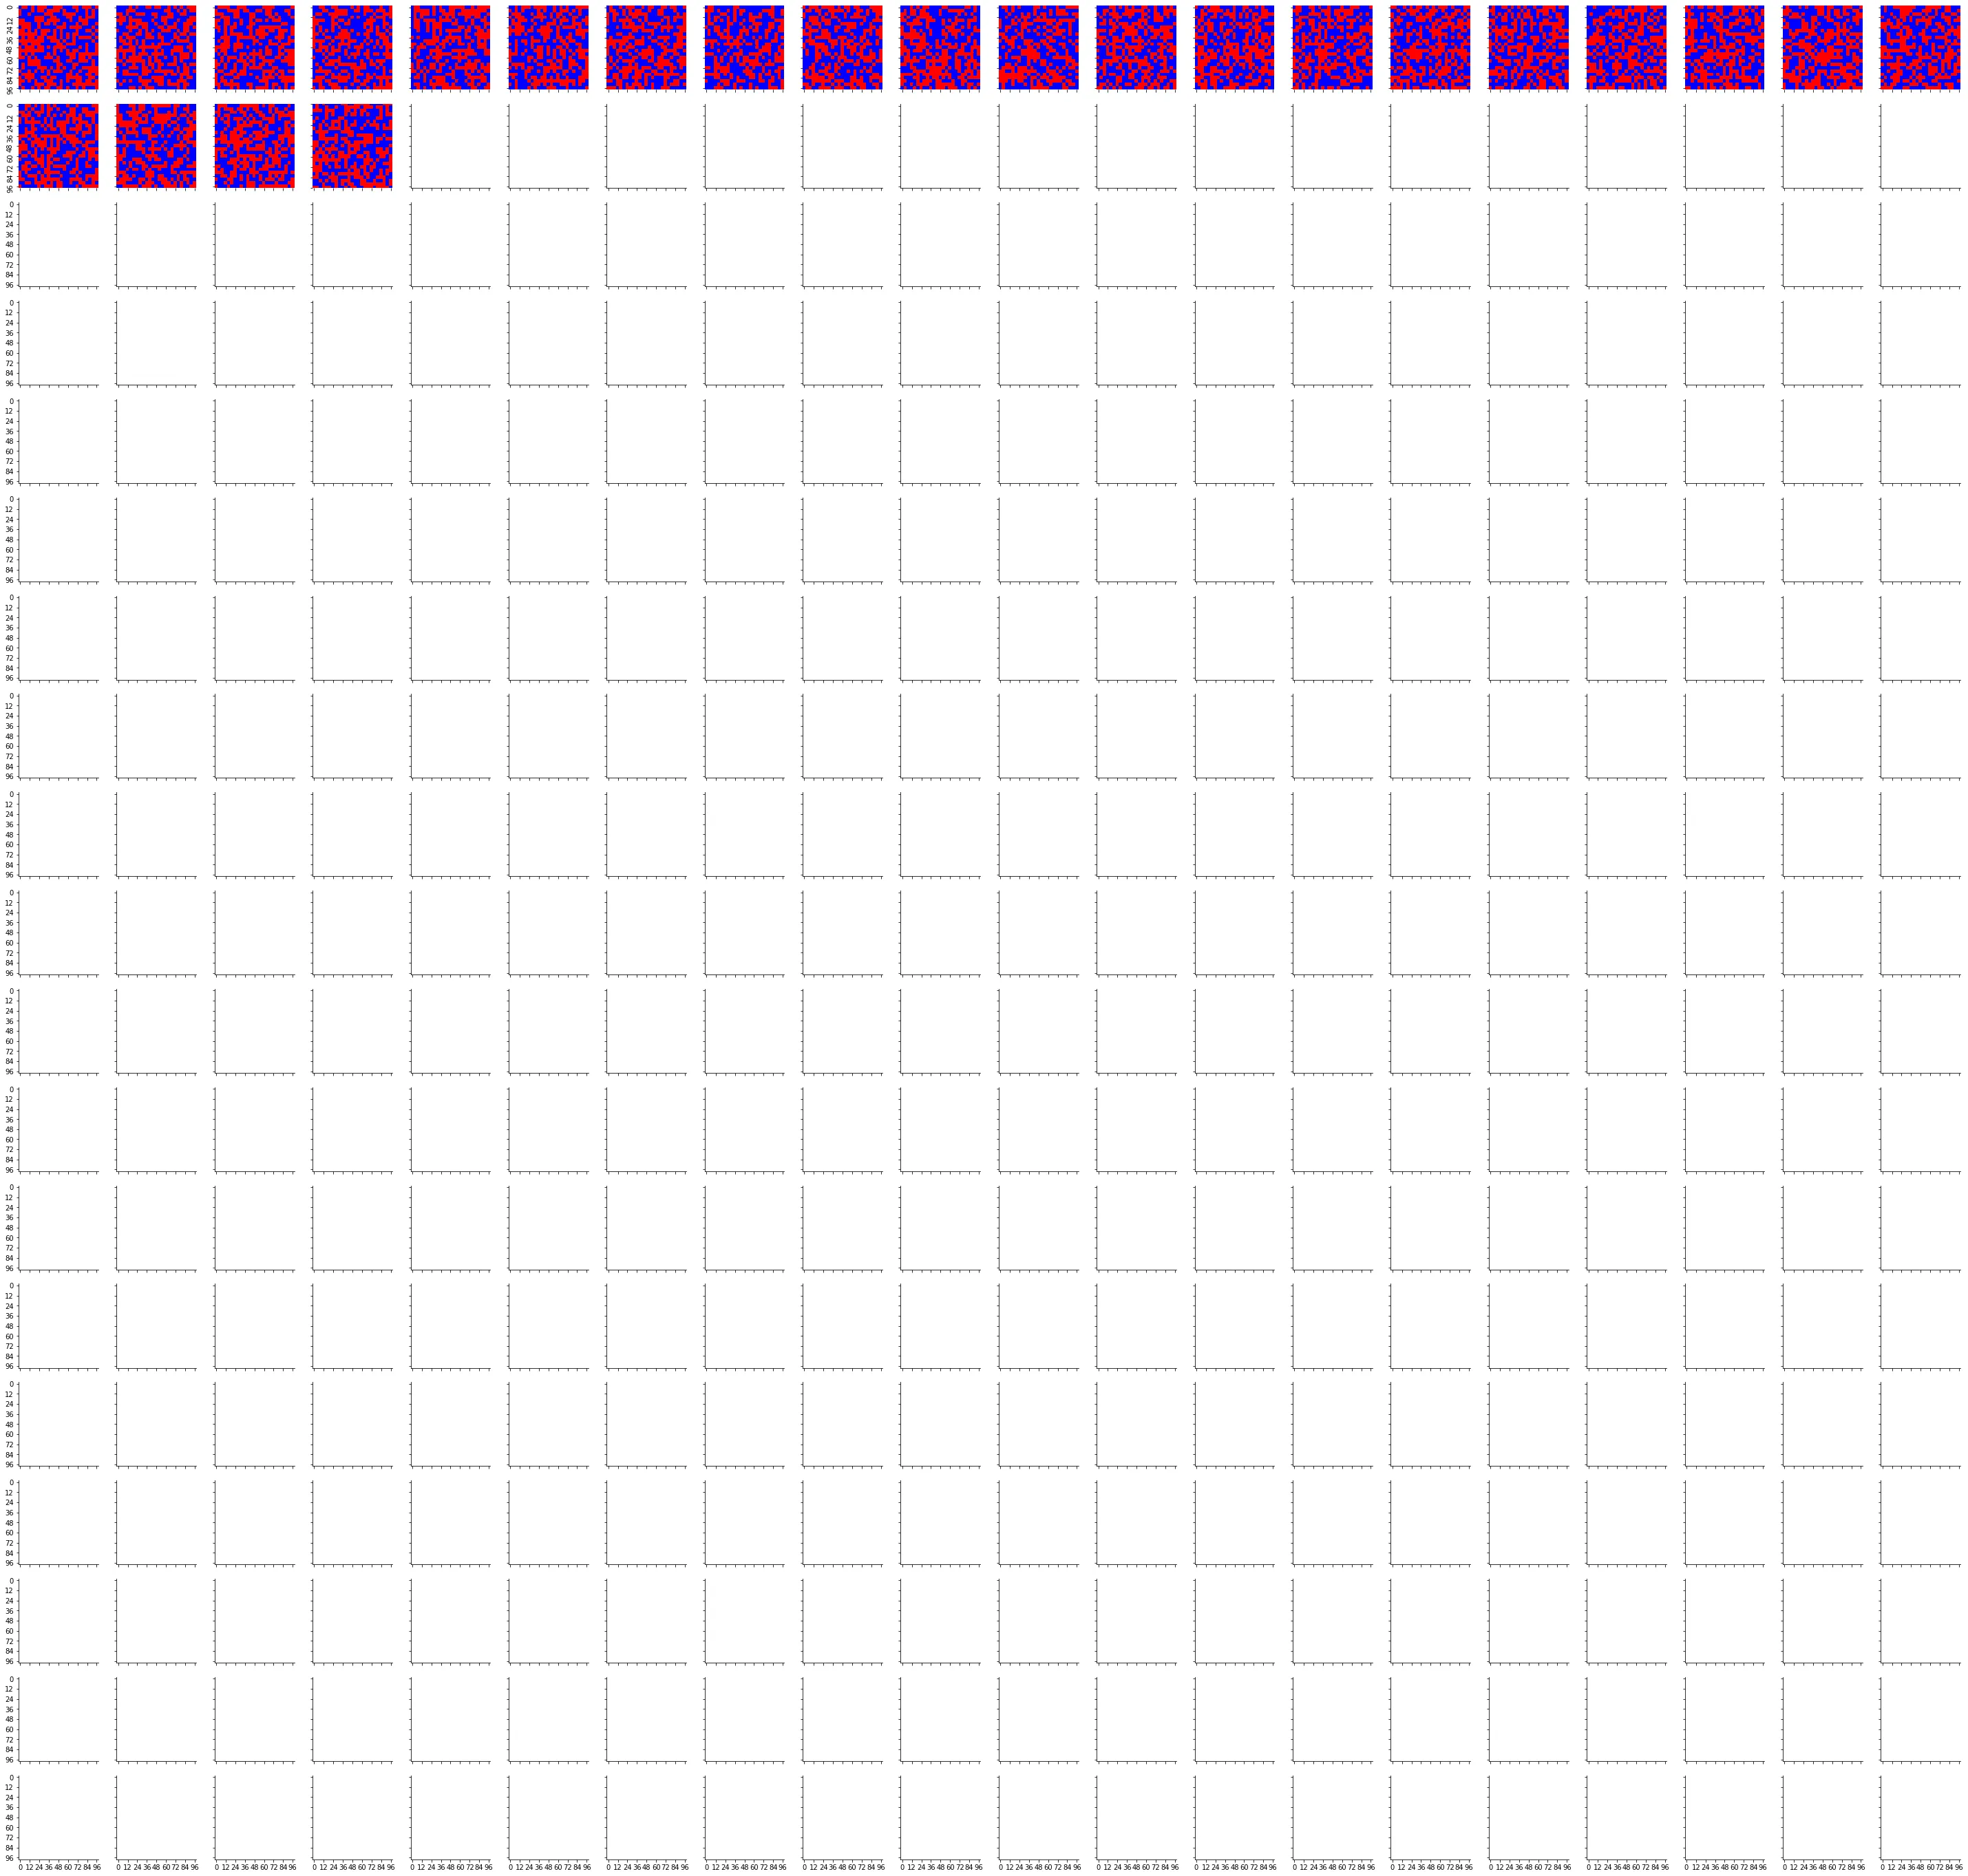
我在一段时间后停止了代码,我们可以看到网格一个接一个地被填充,这是非常耗时的。生成这个热力图速度极慢。

我想知道是否有更好的方法来加快这个过程?

@ImportanceOfBeingErnest,这是一样的。我只是不明白为什么它被投票踩了。 - undefined
@ImportanceOfBeingErnest 对于这样做我表示歉意。但是我花了很多精力将所有内容整理在一起,并对问题陈述更加准确。如果有人没有解释就给出负评,那是不能接受的。 - undefined
1个回答

3

Seaborn速度较慢。如果使用matplotlib代替seaborn,每个图形大约需要半分钟左右。虽然这仍然很长,但考虑到您生成的图形大小为约12000x12000像素,这是可以预期的。

import time
import pandas as pd
import numpy as np
import itertools
import seaborn as sns
from matplotlib.colors import ListedColormap
import matplotlib.pyplot as plt

print("seaborn version {}".format(sns.__version__))
# R expand.grid() function in Python
# https://dev59.com/eGct5IYBdhLWcg3wZMfn#12131385
def expandgrid(*itrs):
   product = list(itertools.product(*itrs))
   return {'Var{}'.format(i+1):[x[i] for x in product] for i in range(len(itrs))}

ltt= ['little1']

methods=["m" + str(i) for i in range(1,21)]
#methods=['method 1', 'method 2', 'method 3', 'method 4']
#labels = ['label1','label2']
labels=["l" + str(i) for i in range(1,20)]

times = range(0,100,4)
data = pd.DataFrame(expandgrid(ltt,methods,labels, times, times))
data.columns = ['ltt','method','labels','dtsi','rtsi']
#data['nw_score'] = np.random.sample(data.shape[0])
data['nw_score'] = np.random.choice([0,1],data.shape[0])

labels_fill = {0:'red',1:'blue'}

del methods
del labels


cmap=ListedColormap(['red', 'blue'])

def facet(data, ax):
    data = data.pivot(index="dtsi", columns='rtsi', values='nw_score')
    ax.imshow(data, cmap=cmap)

def myfacetgrid(data, row, col, figure=None):
    rows = np.unique(data[row].values)  
    cols = np.unique(data[col].values)

    fig, axs = plt.subplots(len(rows), len(cols), 
                            figsize=(2*len(cols)+1, 2*len(rows)+1))


    for i, r in enumerate(rows):
        row_data = data[data[row] == r]
        for j, c in enumerate(cols):
            this_data = row_data[row_data[col] == c]
            facet(this_data, axs[i,j])
    return fig, axs


for lt in data.ltt.unique():

    with sns.plotting_context(font_scale=5.5):
        t = time.time()
        fig, axs = myfacetgrid(data[data.ltt==lt], row="labels", col="method")
        print(time.time()-t)
        for ax,method in zip(axs[0,:],data.method.unique()):
            ax.set_title(method, fontweight='bold', fontsize=12)
        for ax,label in zip(axs[:,0],data.labels.unique()):
            ax.set_ylabel(label, fontweight='bold', fontsize=12, rotation=0, ha='right', va='center')
        print(time.time()-t)
        fig.suptitle(lt, fontweight='bold', fontsize=12)
        fig.tight_layout()
        fig.subplots_adjust(top=0.8) # make some room for the title
        print(time.time()-t)
        fig.savefig(lt+'.png', dpi=300)
        print(time.time()-t)

这里的时间分为大约6秒用于创建facetgrid,大约7秒用于优化网格布局(通过tight_layout - 考虑省略它!),以及15秒用于绘制图形。


网页内容由stack overflow 提供, 点击上面的
可以查看英文原文,
原文链接