考虑以下代码:
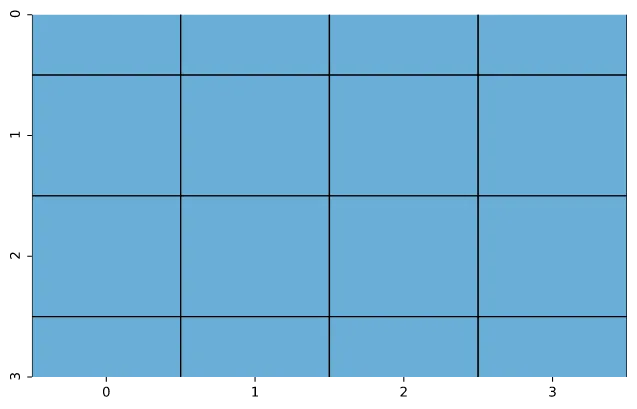
fig, ax = plt.subplots(figsize=(8,5))
sns.heatmap(np.ones((4,4)), ax=ax, cbar=None, cmap="Blues", linewidths=1, linecolor='black')
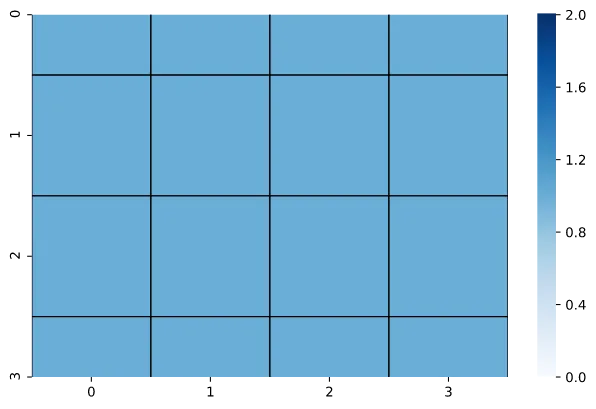
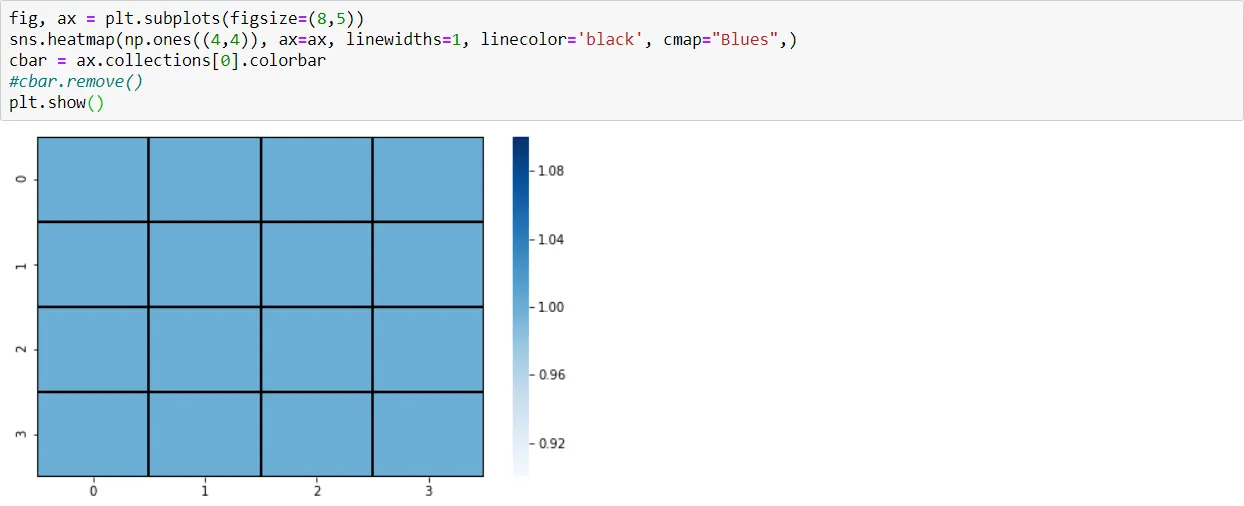
fig, ax = plt.subplots(figsize=(8,5))
sns.heatmap(np.ones((4,4)), ax=ax, cmap="Blues", linewidths=1, linecolor='black')
结果如下:
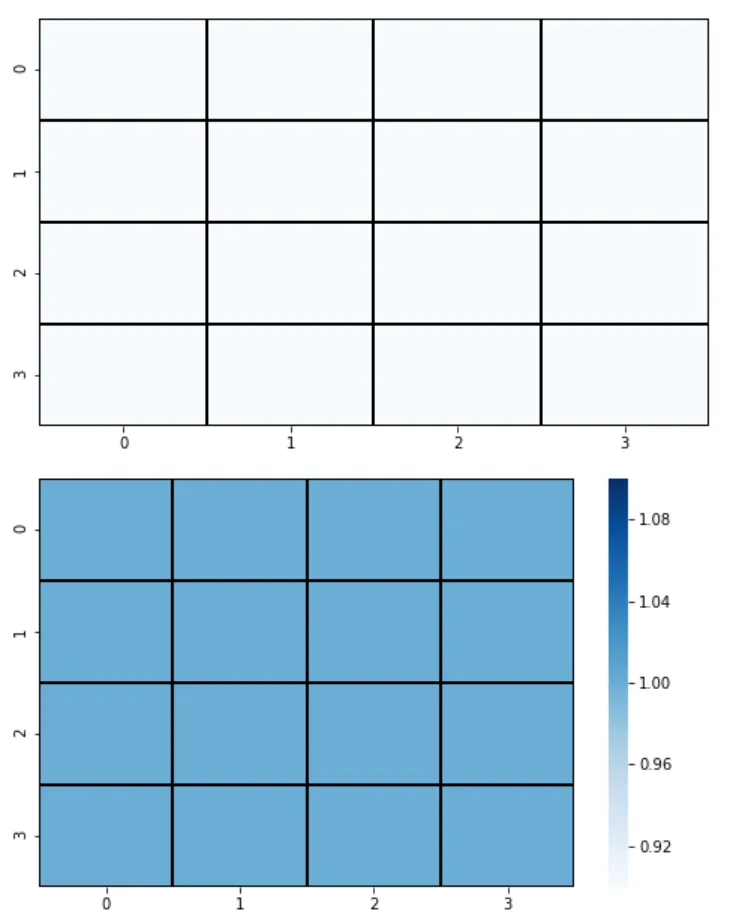
为什么添加参数cbar=None会改变结果呢?
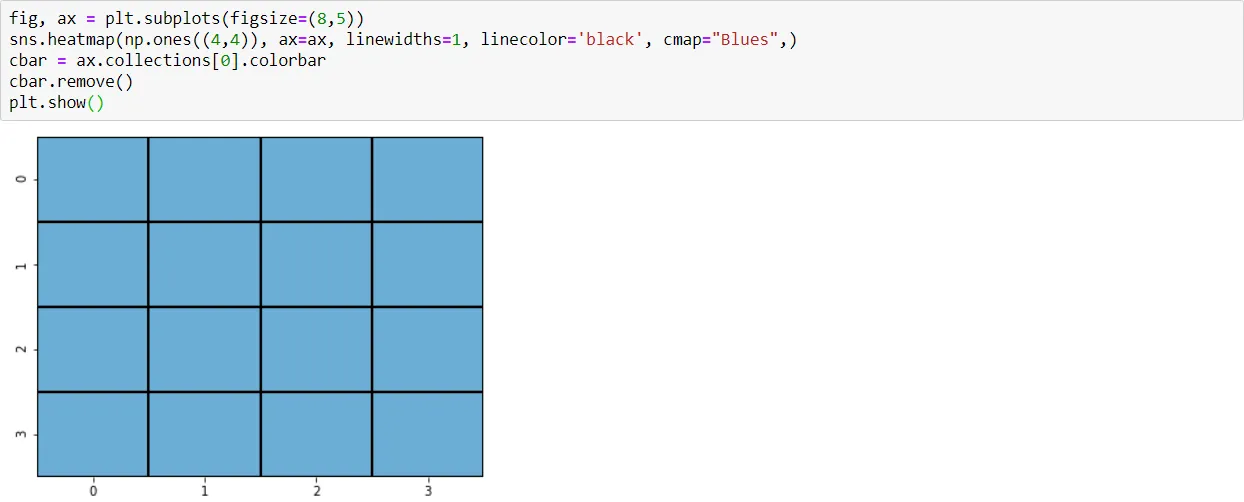
1),则在确定值到颜色的归一化时存在一个自由参数。使用vmin/vmax参数(或norm参数)来固定归一化。 - ImportanceOfBeingErnest