我正在尝试在Seaborn中将百分比表格显示为热度图:
sns.heatmap(S, annot=True, fmt=".1f", linewidths=1.0, square=1)
不过,我希望在热图注释中每个数字后面都能出现百分号。 fmt 标志似乎只接受数字格式说明符。是否有一种方法可以在 Seaborn 中或通过一些 matplotlib 调整来实现这一点?
我正在尝试在Seaborn中将百分比表格显示为热度图:
sns.heatmap(S, annot=True, fmt=".1f", linewidths=1.0, square=1)
不过,我希望在热图注释中每个数字后面都能出现百分号。 fmt 标志似乎只接受数字格式说明符。是否有一种方法可以在 Seaborn 中或通过一些 matplotlib 调整来实现这一点?
import matplotlib.pyplot as plt
import seaborn as sns
import numpy as np
from matplotlib.ticker import FuncFormatter
sns.set()
fig, ax0 = plt.subplots(1,1)
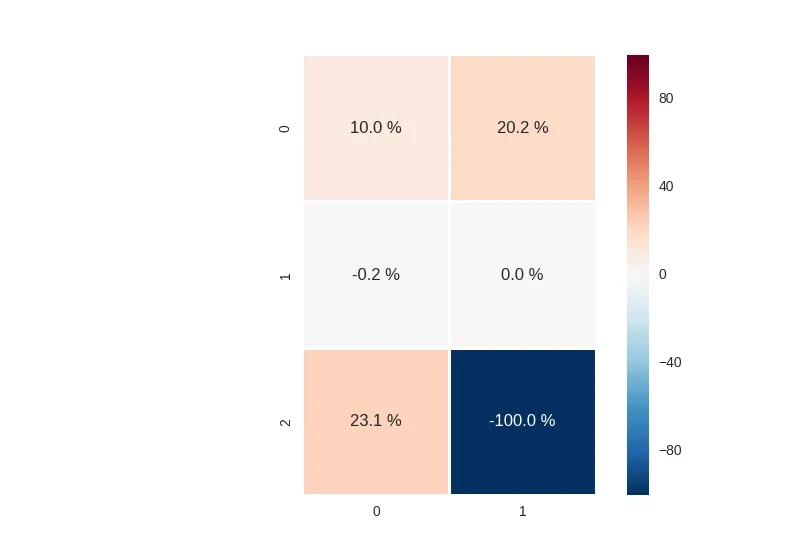
data = np.array([[10.01,20.20],[-0.23,0.],[23.1049,-100.000000]])
ax = sns.heatmap(data, annot=True, fmt = '.1f', square=1, linewidth=1.)
for t in ax.texts: t.set_text(t.get_text() + " %")
plt.show()
将 ".1f" 替换为 ".1%",这样应该就解决了您的问题。
sns.heatmap(S, annot=True, fmt=".1%", linewidths=1.0, square=1)
您需要同时使用fmt参数调整“注释”的格式和cbar_kws调整“colorbar”的格式。
from matplotlib.ticker import FuncFormatter
fmt = lambda x,pos:'{:.0%}'.format(x)
hm = sns.heatmap(data=S, annot=True, ax=ax1, fmt='.1%', cbar_kws={'format': FuncFormatter(fmt)})
请参考此seaborn issue。