使用matplotlib绘制sklearn LinearRegression的输出图表。

5

在使用numpy将文件导入后,当我使用以下代码分离x_values和y_values时:

import pandas as pd
from sklearn import linear_model
from  matplotlib import pyplot 
import numpy as np

#read data
dataframe = pd.read_csv('challenge_dataset.txt')
dataframe.columns=['Brain','Body']
x_values=np.array(dataframe['Brain'],dtype=np.float64).reshape(1,-1)
y_values=np.array(dataframe['Body'],dtype=np.float64).reshape(1,-1)

#train model on data
body_reg = linear_model.LinearRegression()
body_reg.fit(x_values, y_values)
prediction=body_reg.predict(x_values)

print(prediction)
#visualize results
pyplot.scatter(x_values, y_values)
pyplot.plot(x_values,prediction)
pyplot.show()

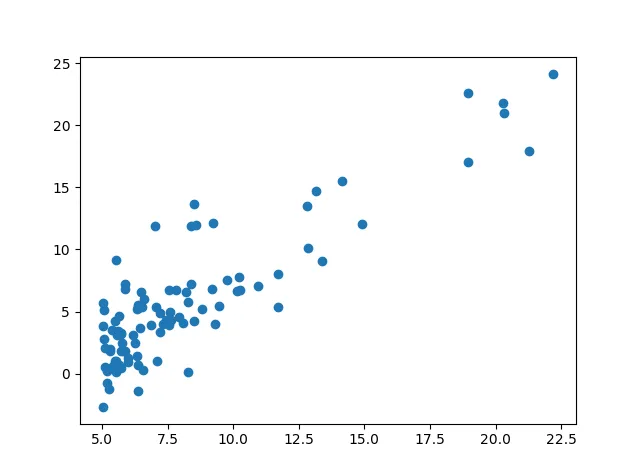
我得到的图像如下,没有显示最佳拟合线,而且当我打印“prediction”的值时,它显示与“y_values”相同的值。 enter image description here 
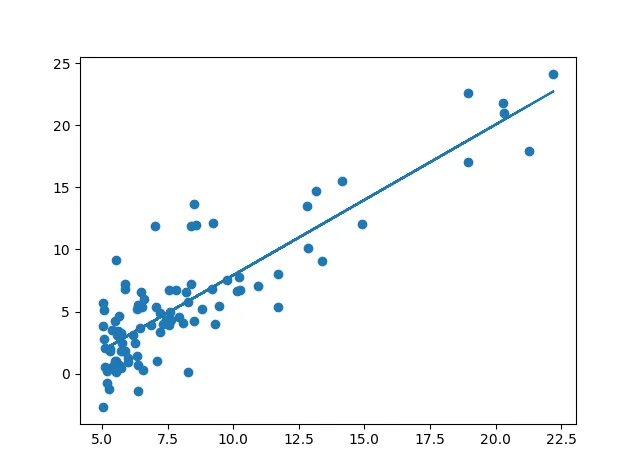
相反,当我使用以下代码时,我得到了回归线。
#read data
dataframe = pd.read_csv('challenge_dataset.txt')
dataframe.columns=['Brain','Body']
x_values=dataframe[['Brain']]
y_values=dataframe[['Body']]

enter image description here

为什么会这样呢?
提前致谢。

.reshape(1,-1) 的原因是什么? - ImportanceOfBeingErnest
x_values=np.array(dataframe['Brain'],dtype=np.float64).reshape(1,-1) 这里我将“Brain”这一列的值以一维数组的形式取出来,虽然可以用二维数组表示,但是我当时只是在做实验。 - Mayank Raj
我的意思是,如果你不使用.reshape(1,-1)会发生什么? - ImportanceOfBeingErnest
它抛出了这个错误。ValueError: 期望一个二维数组,但得到了一个一维数组: - Mayank Raj
1个回答

7

linear_model.LinearRegression().fit(X,y),它期望的参数为:

X :形状为 [n_samples,n_features] 的 numpy 数组或稀疏矩阵
y :形状为 [n_samples, n_targets] 的 numpy 数组

在这里,您只有1个“特征”和1个“目标”,因此输入的期望形状应为(n_samples,1)

对于其他情况则有所不同。

x_values=dataframe[['Brain']]
y_values=dataframe[['Body']]

np.array(dataframe['Brain'],dtype=np.float64).reshape(1,-1) 的形状是 (n_samples,)

从数据框中获取所需的形状的另一种选项是通过添加新的轴将它们广播到 2D 数组。

x_values=dataframe['Brain'].values[:,np.newaxis]
y_values=dataframe['Body'].values[:,np.newaxis]

请注意,为了显示一条漂亮的线,您可能需要对x值进行排序。
import pandas as pd
from sklearn import linear_model
from  matplotlib import pyplot 
import numpy as np

#read data
x = np.random.rand(25,2)
x[:,1] = 2*x[:,0]+np.random.rand(25)
dataframe = pd.DataFrame(x,columns=['Brain','Body'])


x_values=dataframe['Brain'].values[:,np.newaxis]
y_values=dataframe['Body'].values[:,np.newaxis]

body_reg = linear_model.LinearRegression()
body_reg.fit(x_values, y_values)
prediction=body_reg.predict(np.sort(x_values, axis=0))

pyplot.scatter(x_values, y_values)
pyplot.plot(np.sort(x_values, axis=0),prediction)
pyplot.show()

enter image description here


网页内容由stack overflow 提供, 点击上面的
可以查看英文原文,
原文链接