多重索引 Seaborn 折线图

3
我有一个多重索引的数据框,其中两个索引是样品和岩性。
 Sample        20EC-P     20EC-8  20EC-10-1  ...     20EC-43    20EC-45    20EC-54
Lithology         Pd     Di-Grd         Gb  ... Hbl Plag Pd     Di-Grd         Gb
Rb          7.401575  39.055118   6.456693  ...    0.629921  56.535433  11.653543
Ba         24.610102  43.067678  10.716841  ...    1.073115  58.520532  56.946630
Th          3.176471  19.647059   3.647059  ...    0.823529  29.647059   5.294118

我正在尝试将其放入seaborn折线图中,如下所示。
spider = sns.lineplot(data = data, hue = data.columns.get_level_values("Lithology"),
                      style = data.columns.get_level_values("Sample"),
                      dashes = False, palette = "deep")

线图显示为: 1 我有两个问题。首先,我想按岩性格式化色调,并按样本格式化样式。在线图函数之外,我可以成功地使用data.columns.get_level_values访问样本和岩性,但在线图中它们似乎没有起到任何作用,我还没有找到另一种访问这些值的方法。此外,线图通过字母顺序重新组织x轴。我想强制它保持与数据框相同的顺序,但我在文档中看不到任何方法。
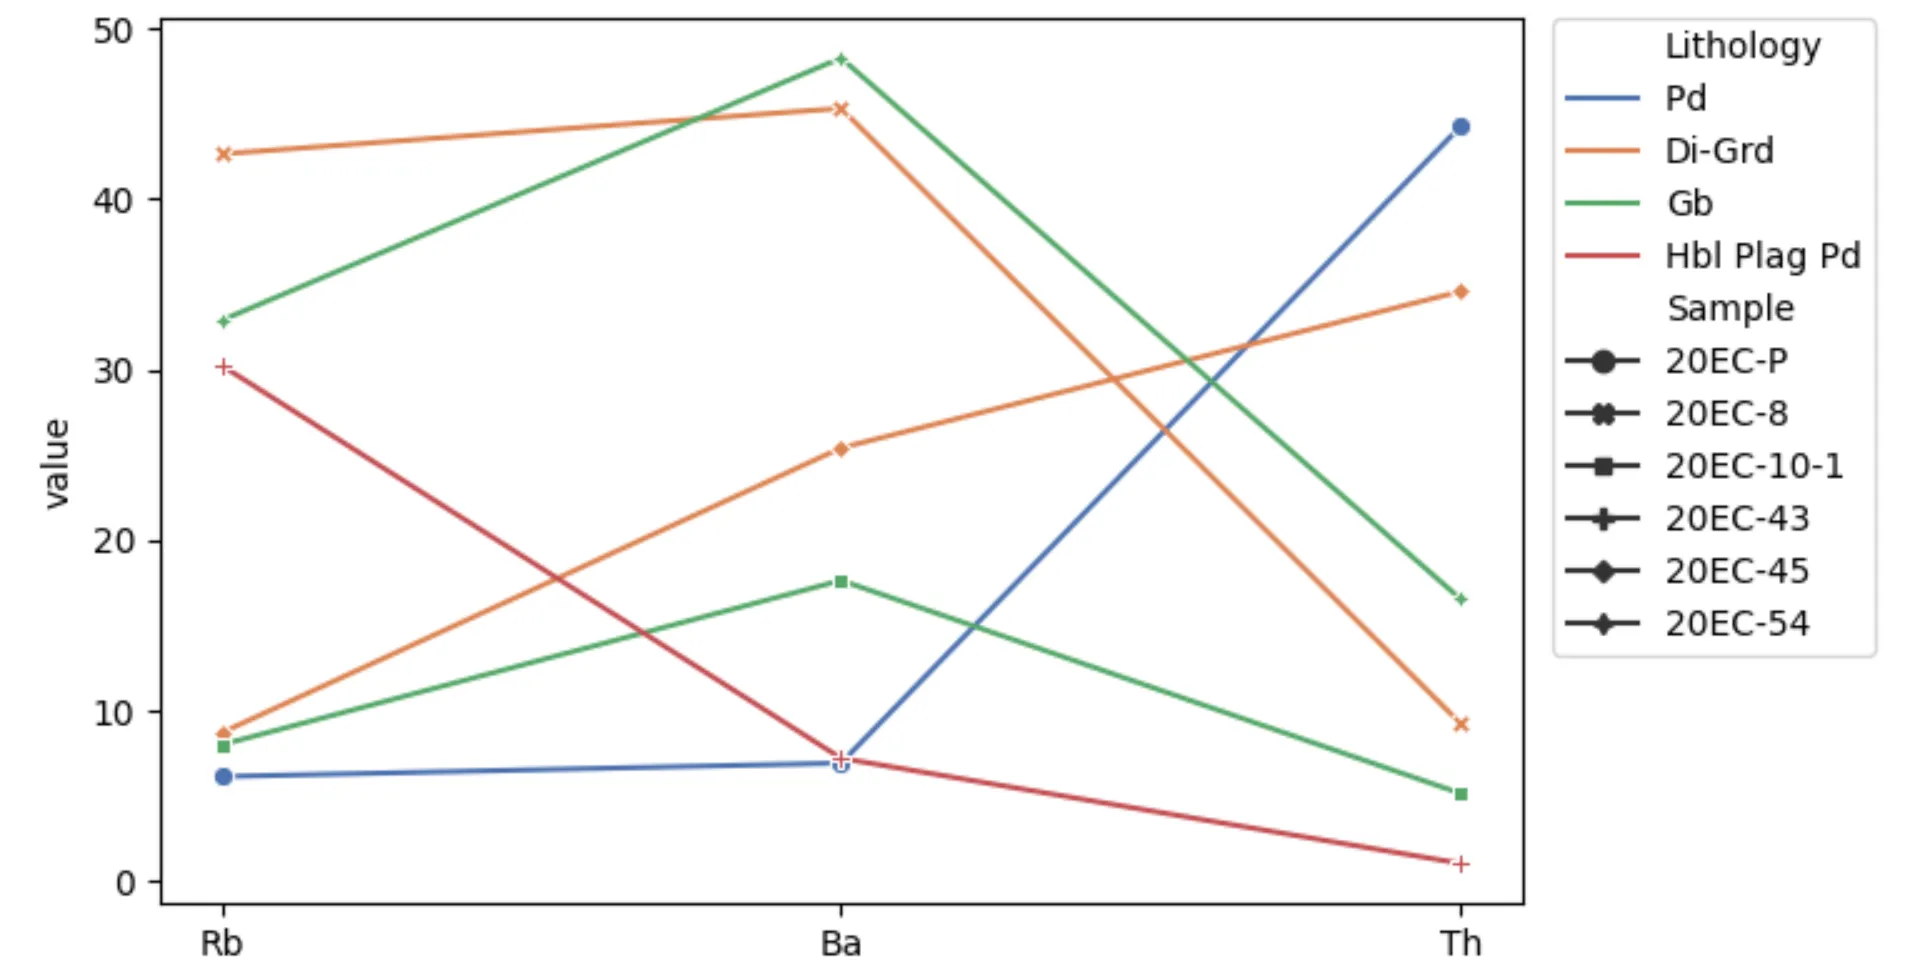
1个回答

2
为了使用hue=style=,seaborn更喜欢采用长格式的数据框(long form)。pd.melt()会将所有列组合在一起,并创建新列,旧列名和数值都将被包含在其中。同时需要将索引转换为常规列(使用.reset_index())。
大多数seaborn函数使用order=设置x-value的顺序,但是在lineplot中,唯一的方法是将列设置为分类变量并应用固定的顺序。
from matplotlib import pyplot as plt
import seaborn as sns
import pandas as pd
import numpy as np

column_tuples = [('20EC-P', 'Pd '), ('20EC-8', 'Di-Grd'), ('20EC-10-1 ', 'Gb'),
                 ('20EC-43', 'Hbl Plag Pd'), ('20EC-45', 'Di-Grd'), ('20EC-54', 'Gb')]
col_index = pd.MultiIndex.from_tuples(column_tuples, names=["Sample", "Lithology"])
data = pd.DataFrame(np.random.uniform(0, 50, size=(3, len(col_index))), columns=col_index, index=['Rb', 'Ba', 'Th'])

data_long = data.melt(ignore_index=False).reset_index()
data_long['index'] = pd.Categorical(data_long['index'], data.index) # make categorical, use order of the original dataframe
ax = sns.lineplot(data=data_long, x='index', y='value',
                  hue="Lithology", style="Sample", dashes=False, markers=True, palette="deep")
ax.set_xlabel('')

ax.legend(loc='upper left', bbox_to_anchor=(1.01, 1.02))
plt.tight_layout()  # fit legend and labels into the figure
plt.show()

sns.lineplot from multiindexed columns

长数据框的样子如下所示:

   index      Sample    Lithology      value
0     Rb      20EC-P          Pd    6.135005
1     Ba      20EC-P          Pd    6.924961
2     Th      20EC-P          Pd   44.270570
...

非常感谢您的帮助。然而,我遇到了另一个错误。您应用melt函数的那一行返回了一个错误:“TypeError: melt() got an unexpected keyword argument 'ignore_index'”。错误信息只指向那一行,并没有其他提示。这是唯一的错误,如果我不使用ignore_index参数运行它,它会按预期返回数据框,但索引中的元素名称将被替换为nan。 - undefined
你真的需要升级你的pandas版本。 - undefined

网页内容由stack overflow 提供, 点击上面的
可以查看英文原文,
原文链接