我试图完全删除Seaborn中折线图的图例。有三个折线图在2x2子图中,每个都像这样命名:
g = sns.lineplot(data=df, dashes=False, ax=axs[0,1])
更具体地说,我想在每个折线图中摆脱图例,然后使用2x2绘图中的第四个区域显示图例。任何建议都将不胜感激!
我试图完全删除Seaborn中折线图的图例。有三个折线图在2x2子图中,每个都像这样命名:
g = sns.lineplot(data=df, dashes=False, ax=axs[0,1])
更具体地说,我想在每个折线图中摆脱图例,然后使用2x2绘图中的第四个区域显示图例。任何建议都将不胜感激!
您可以为前三个轴中的每个图例删除图例,然后使用plt.figlegend(),它是整个图形的图例。根据您的图例中包含的内容,您可能需要调整bbox_to_anchor()参数。
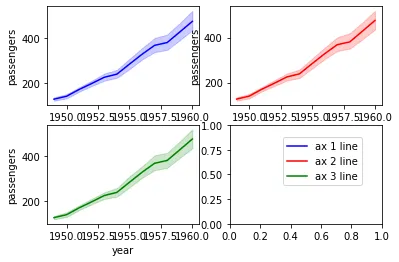
import seaborn as sns

df = sns.load_dataset('flights')

fig, ax = plt.subplots(2,2)

ax1 = sns.lineplot(x=df['year'],y=df['passengers'],
                   color='b',dashes=False,label='ax 1 line',ax=ax[0,0])
ax2 = sns.lineplot(x=df['year'],y=df['passengers'],
                   color='r',dashes=False,label='ax 2 line',ax=ax[0,1])
ax3 = sns.lineplot(x=df['year'],y=df['passengers'],
                   color='g',dashes=False,label='ax 3 line',ax=ax[1,0])
ax1.get_legend().remove()
ax2.get_legend().remove()
ax3.get_legend().remove()
plt.figlegend(loc='lower right',bbox_to_anchor=(0.85,0.25))

plt.show()
结果:
legend=None(例如sns.lineplot(x=df['year'],y=df['passengers'], color='b',dashes=False,label='ax 1 line',ax=ax[0,0], legend=None))比ax1.get_legend().remove()更好。 ax1是多余的 - 只需使用ax [0,0]即可。 使用ax[1,1].remove()来删除未使用的子图。代码和图表 - Trenton McKinney
seaborn >= 0.11.2,要移动图例,请使用seaborn.move_legend,它适用于Axes和Figure级别的绘图,并且接受kwargs,例如title。 - Trenton McKinney