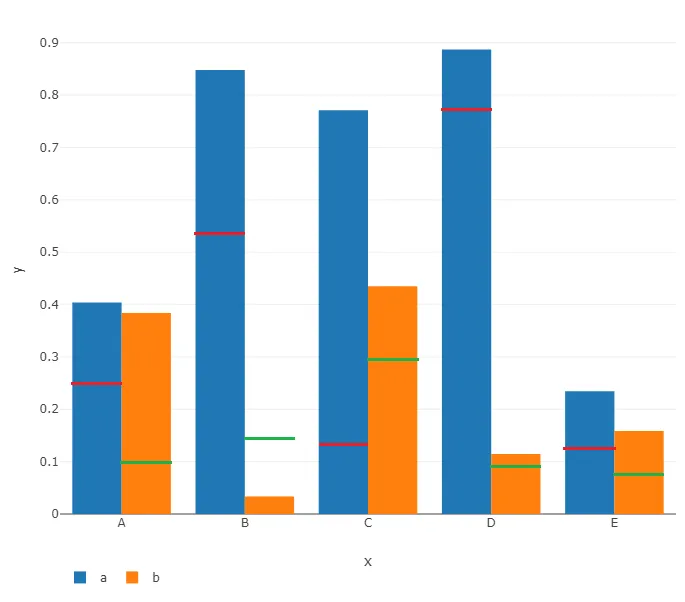
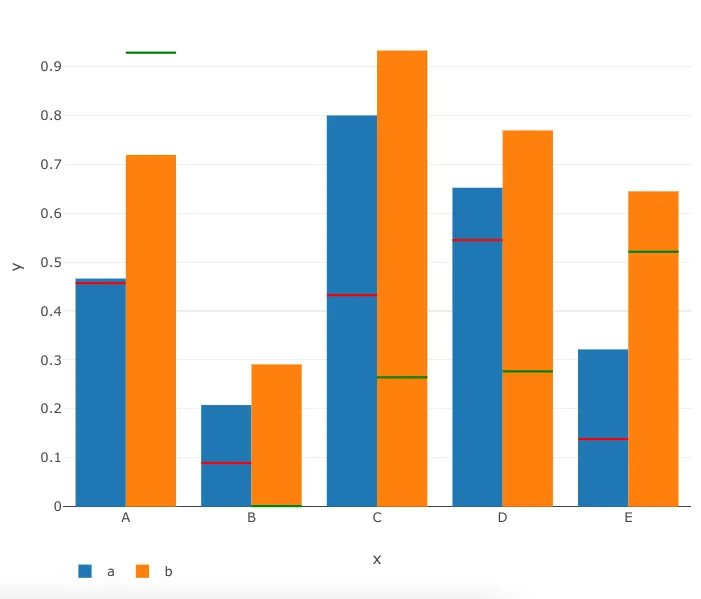
R Plotly 条形图 - 添加水平线标记

4
我想绘制一个柱状图,每个类别(LETTERS)有两个并排的柱子,并且要在每个柱子上添加一条水平线(红线用y_ref表示, 绿线用z_ref表示)。它应该看起来像这样:

enter image description here

我试着用 add_trace (和 add_lines, add_segment等),但是找不到正确的方法使它正常工作。以下是我迄今为止尝试过的其中之一。
df <- tibble(x = LETTERS[1:5], y = runif(5), z = runif(5), y_ref = runif(5), z_ref = runif(5))

plot_ly(
  df,
  x = ~x,
  y = ~y,
  type = "bar",
  name = "a"
) %>% add_trace(
  y = ~z, 
  name = "b"
) %>% layout(
  legend = list(
    orientation = "h"
  )
) %>% add_trace(
  y = ~y_ref, 
  type = 'scatter', 
  mode = 'lines',
  marker = list(
    line = list(
      width = 2,
      color = "red"
    )
  )
) %>% add_trace(
  y = ~z_ref, 
  type = 'scatter', 
  mode = 'lines',
  marker = list(
    line = list(
      width = 2,
      color = "green"
    )
  )
)

编辑:我需要解决n个条的问题。

1个回答

3

在Plotly中,你需要使用shapes来绘制线段。此外,由于x轴是离散的,因此形状的x值需要在paper空间中。

当在paper空间中工作时,您使用绘图的domain来确定x的值。对于xy轴,Plotly默认的domain设置为[0, 1]。

还有一个间隔需要考虑在内。我使用了三个函数来创建线段,并利用所有这些信息。

最后,我使用了一个seed来保证重复性。

库,种子和基本图

library(tidyverse)
library(plotly)

set.seed(8)
df <- tibble(x = LETTERS[1:5], y = runif(5), z = runif(5),
             y_ref = runif(5), z_ref = runif(5))

p = plot_ly(df, x = ~x, y = ~y,
        type = "bar", name = "a") %>% 
  add_trace(y = ~z, name = "b") 

创建段落。
# standard shape elements, call for color
details <- function(col){
  list(type = 'line',
       line = list(color = col),
       xref = "paper", yref = "y")
}
# green lines for orange bars
segs = lapply(1:nrow(df),
              function(k){
                x1 <- (k + k)/10 - .02  # if the domain is [0, 1]
                x0 <- x1 - .08
                y0 <- y1 <- df[k, ]$z_ref
                line = list("x0" = x0, "x1" = x1,
                            "y0" = y0, "y1" = y1)
                deets = details("green")
                c(deets, line)
              })
# green lines for blue bars
segs2 = lapply(1:nrow(df),
               function(j){
                 x1 <- (j + j - 1)/10  # if the domain is [0, 1]
                 x0 <- x1 - .08
                 y0 <- y1 <- df[j, ]$y_ref
                 line = list("x0" = x0, "x1" = x1,
                             "y0" = y0, "y1" = y1)
                 deets = details("red")
                 c(deets, line)
               })
segs = append(segs, segs2)
将其组合在一起
p %>% layout(legend = list(orientation = "h"),
             shapes = segs) 

enter image description here


1
我猜你是指不同数量的“形状”?如果是这样,那肯定可以。它们实际上并没有与列绑定;它们只是在这个答案中以那种方式呈现。 - Kat
是的,我刚刚弄明白了。在右边,它是 x1 = (k + k)/(2*n) - (1/(10*n))x0 = (1/(2.5*n)),在左边,它是 x1 = (j + j - 1)/(2*n)x0 = x1 - (1/(2.5*n))。(顺便说一下,我不小心删除了我的先前评论,在那里我询问了n个条的通用解决方案)。 - sedsiv

网页内容由stack overflow 提供, 点击上面的
可以查看英文原文,
原文链接