我的代码:
x <- c(10, 50, 20, 40)
barplot(x, names.arg=LETTERS[1:4])
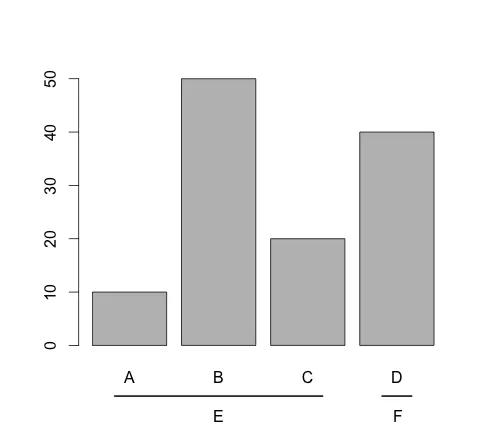
我想要的是:
我用R和Adobe Acrobat的帮助制作了这个图表。我想知道是否可以使用纯R代码获得此图表?
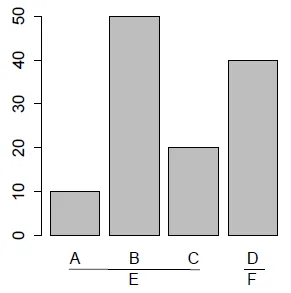
您可以使用mtext添加文本
mtext("E", side = 1, line = 3, adj = 0.375)
mtext("F", side = 1, line = 3, adj = 0.875)
然后使用lines函数画线,但要指定xpd=T
lines(c(0,3.5),c(-10,-10),xpd=TRUE)
lines(c(3.8,4.8),c(-10,-10),xpd=TRUE)
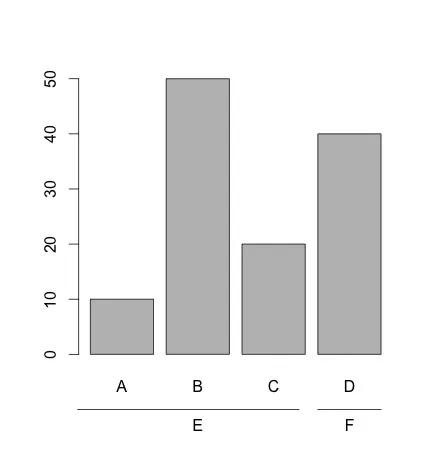
x <- c(10, 50, 20, 40)
barplot(x, names.arg=LETTERS[1:4])

mtext("E", side = 1, line = 3, adj = 0.375)
mtext("F", side = 1, line = 3, adj = 0.875)

axis(1, at=c(0.5,1,2,3,3.3), line=2.5, tick=T, labels=rep("",5), lwd=2, lwd.ticks=0)
axis(1, at=4+c(0.1,0.2,0.3,0.4,0.5),line=2.5,tick=T,labels=rep("",5), lwd=2, lwd.ticks=0)