标题已经说得很清楚了。 我有一个笔记本,其中包含两个子图,并希望在它们之间创建一些间距。 它们看起来太靠近彼此了。
1个回答
15
使用matplotlib.Figure.subplots_adjust:
import matplotlib.pyplot as plt
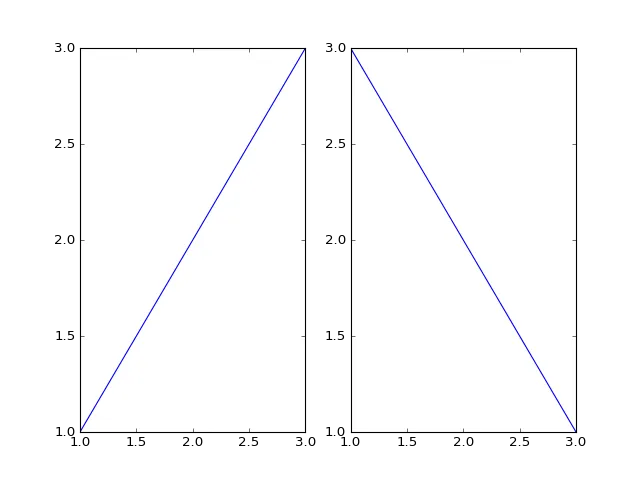
fig, (ax1, ax2) = plt.subplots(1, 2)
ax1.plot([1,2,3], [1,2,3])
ax2.plot([1,2,3], [3,2,1])
plt.show()
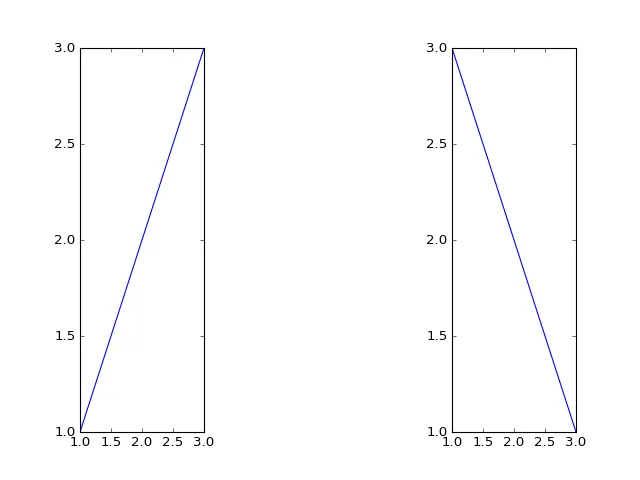
可以使用wspace参数来增加宽度:
... # same setup as before
fig.subplots_adjust(wspace=2)
plt.show()
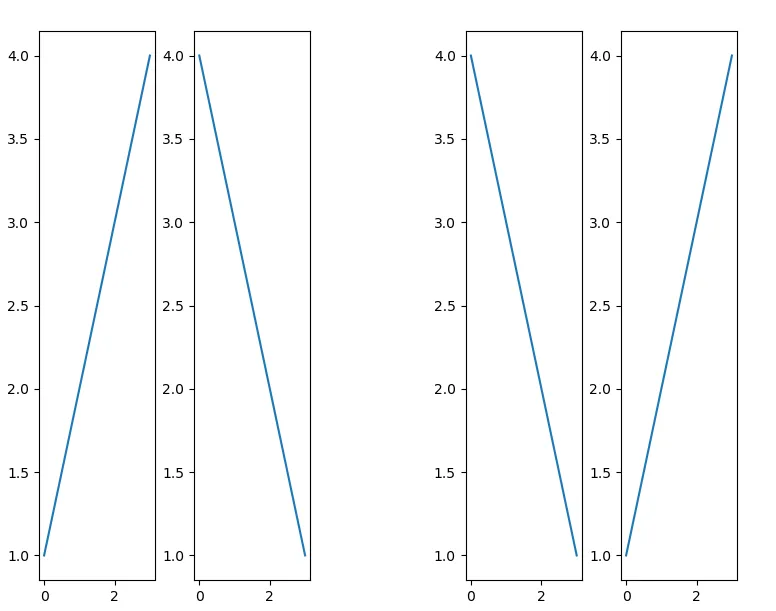
如果您想更精确地控制axes的位置,可以将每个轴的偏移量(底部和左侧)以及扩展(宽度和高度)指定为图形的百分比。
但是,这需要进行一些计算才能准确设置:
import matplotlib.pyplot as plt

# All have the same lower border, height and width, only the distance to
# the left end of the figure differs
bottom = 0.05
height = 0.9
width = 0.15  # * 4 = 0.6 - minus the 0.1 padding 0.3 left for space
left1, left2, left3, left4 = 0.05, 0.25, 1 - 0.25 - width, 1 - 0.05 - width

rectangle1 = [left1, bottom, width, height]
rectangle2 = [left2, bottom, width, height]
rectangle3 = [left3, bottom, width, height]
rectangle4 = [left4, bottom, width, height]

# Create a 8 x 8 (quadratic) figure
plt.figure(1, figsize=(8, 8))

// Create 4 axes their position and extend is defined by the rectangles
ax1 = plt.axes(rectangle1)
ax2 = plt.axes(rectangle2)
ax3 = plt.axes(rectangle3)
ax4 = plt.axes(rectangle4)

# Let's display something in these axes.
ax1.plot([1,2,3,4])
ax2.plot([4,3,2,1])
ax3.plot([4,3,2,1])
ax4.plot([1,2,3,4])

plt.show()
- MSeifert
4
那样会缩小图表。有没有一种方法只增加空间? - Victor Eijkhout
2@VictorEijkhout 不行,因为图形大小是固定的。因此,如果您只想增加空间,则必须增加图形大小和wspace。 - MSeifert
如果有四个,如何在其中仅使用两个? - droid192
1@ItsmeJulian 我更新了回答。通常最好提出一个新问题 - 但是我想添加一个更一般的方法,所以感谢您的提醒 :) - MSeifert
网页内容由stack overflow 提供, 点击上面的可以查看英文原文,
原文链接
原文链接