如何在matplotlib中调整每第二行子图之间的间距

9

我希望调整子图之间的水平间距,特别是在每第二行之间。我可以使用fig.subplots_adjust(hspace=n)来调整每一行,但是是否可能将其应用于每第二行?

import matplotlib.pyplot as plt

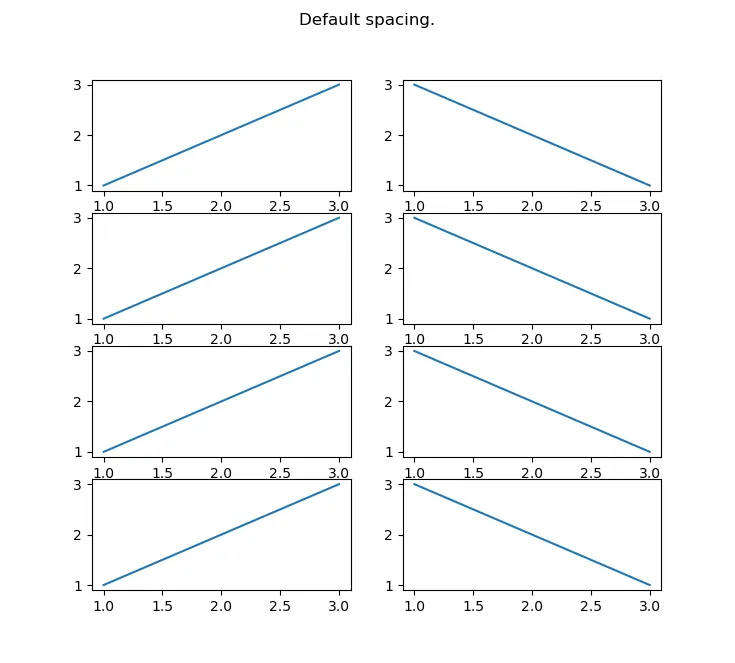
fig, ax = plt.subplots(figsize = (10,10))
plt.style.use('ggplot')
ax.grid(False)

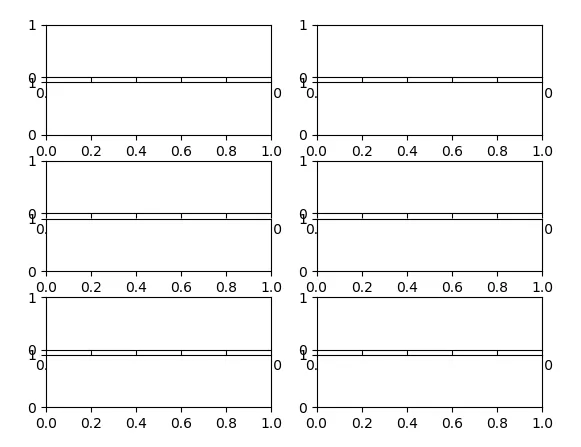
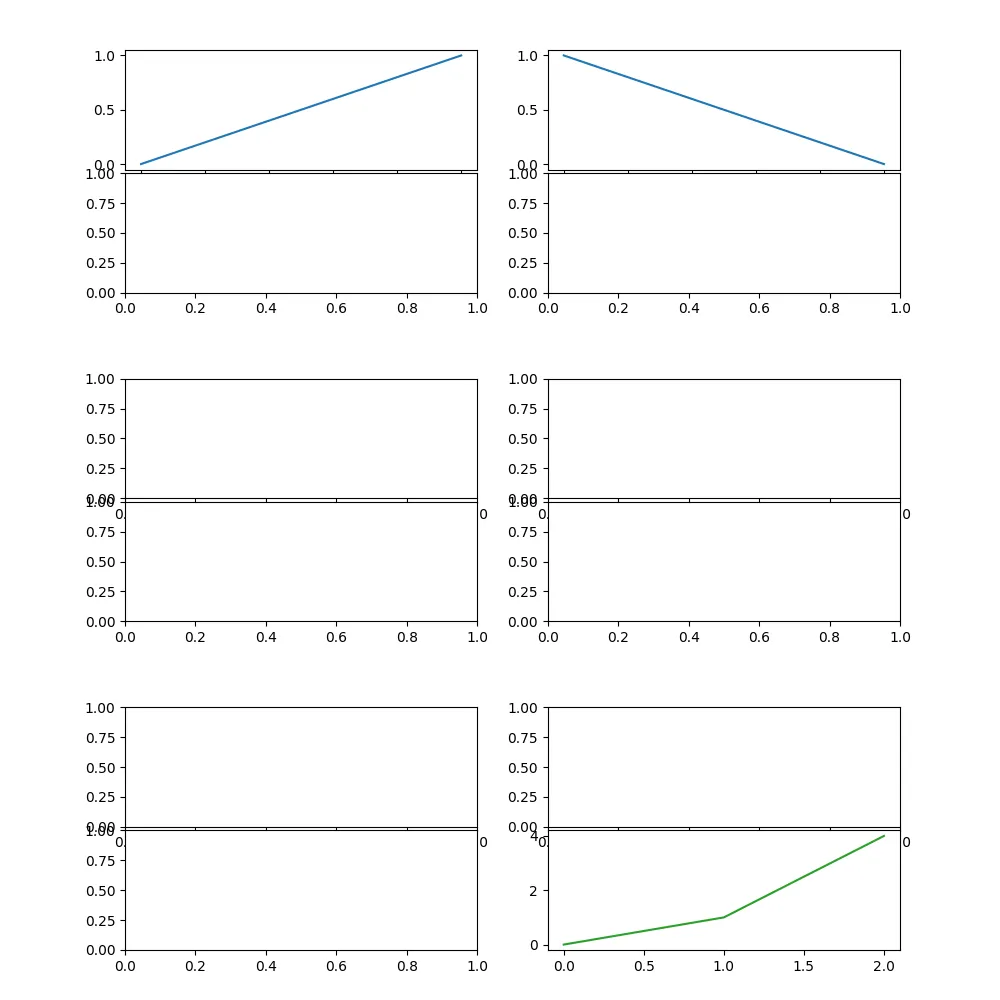
ax1 = plt.subplot2grid((5,2), (0, 0))
ax2 = plt.subplot2grid((5,2), (0, 1))
ax3 = plt.subplot2grid((5,2), (1, 0))  
ax4 = plt.subplot2grid((5,2), (1, 1))
ax5 = plt.subplot2grid((5,2), (2, 0))
ax6 = plt.subplot2grid((5,2), (2, 1)) 
ax7 = plt.subplot2grid((5,2), (3, 0))
ax8 = plt.subplot2grid((5,2), (3, 1))

fig.subplots_adjust(hspace=0.9)

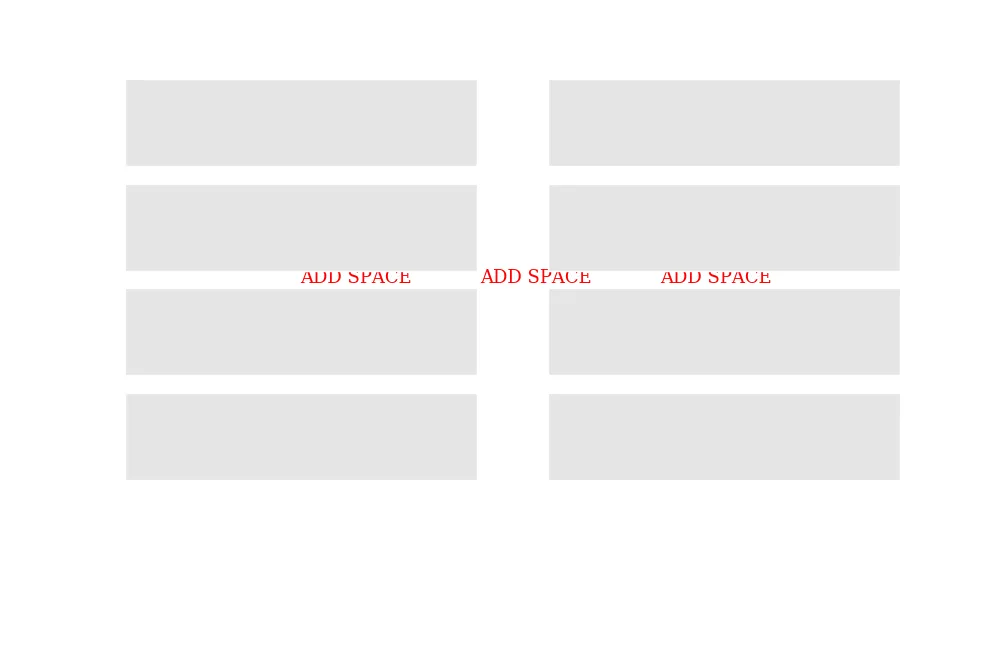
使用下面的子图,我希望在第2行和第3行之间添加一个空格,并保持其余部分不变。 enter image description here

fig, ax = plt.subplots(figsize=(30, 30)) 更改 figsize 就是更改图形的大小。 - user2906838
我正在Jupyter笔记本中运行相同的代码,但我只是更改了figsize参数,这个参数可以很好地工作。关于
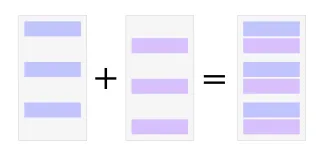
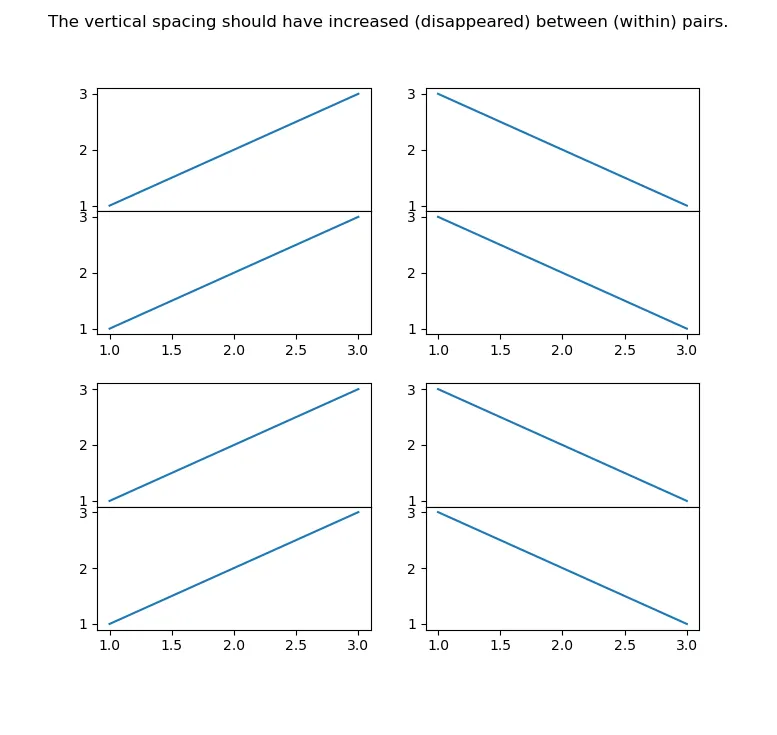
hspace,根据官方文档,hspace的目的是调整每一行之间的空间,要实现每隔两行相同功能但不同的设置,你需要自己寻找合适的方法。 - user2906838
我撤销了编辑,因为否则它就成为了完全不同的问题。 - ImportanceOfBeingErnest
3个回答

9
你可以交错两个网格,使得每隔一个子图之间有更大的间距。
为了说明这个概念:

enter image description here

import matplotlib.pyplot as plt
from matplotlib.gridspec import GridSpec

n = 3 # number of double-rows
m = 2 # number of columns

t = 0.9 # 1-t == top space 
b = 0.1 # bottom space      (both in figure coordinates)

msp = 0.1 # minor spacing
sp = 0.5  # major spacing

offs=(1+msp)*(t-b)/(2*n+n*msp+(n-1)*sp) # grid offset
hspace = sp+msp+1 #height space per grid

gso = GridSpec(n,m, bottom=b+offs, top=t, hspace=hspace)
gse = GridSpec(n,m, bottom=b, top=t-offs, hspace=hspace)

fig = plt.figure()
axes = []
for i in range(n*m):
    axes.append(fig.add_subplot(gso[i]))
    axes.append(fig.add_subplot(gse[i]))

plt.show()

enter image description here


谢谢@ImportofBeingErnest。但是我如何将数据分配给特定的subplot?请参见问题中的更新。 - user9639519
要绘制数据,您可以使用轴的适当绘图函数。例如:axes[0].plot([1,2,3]) - ImportanceOfBeingErnest

5

如果不想使用繁琐的低级技巧来手动调整轴的位置,我建议使用网格但只留下一些空行。

我尝试过这样:

import matplotlib.pyplot as plt

plt.figure(figsize=(10., 10.))

num_rows = 6
num_cols = 2

row_height = 3
space_height = 2

num_sep_rows = lambda x: int((x-1)/2)
grid = (row_height*num_rows + space_height*num_sep_rows(num_rows), num_cols)

ax_list = []

for ind_row in range(num_rows):
    for ind_col in range(num_cols):
        grid_row = row_height*ind_row + space_height*num_sep_rows(ind_row+1)
        grid_col = ind_col

        ax_list += [plt.subplot2grid(grid, (grid_row, grid_col), rowspan=row_height)]

plt.subplots_adjust(bottom=.05, top=.95, hspace=.1)

# plot stuff
ax_list[0].plot([0, 1])
ax_list[1].plot([1, 0])
# ...
ax_list[11].plot([0, 1, 4], c='C2')

这将产生以下结果:

example output

注意,您可以更改行数;此外,您可以通过调整row_height/space_height比例(两个必须是整数)来调整空白间隙与子图之间的大小。


谢谢@cheersmate。这很好,但我如何为每个子图分配不同的输出? - user9639519
我更新了我的答案,只需使用ax_list中的轴并绘制您想要的任何内容。 - cheersmate

1
这是一个解决方案,而且不需要进行繁琐的低级别黑客攻击:
import matplotlib.pyplot as plt

def tight_pairs(n_cols, fig=None):
    """
    Stitch vertical pairs together.

    Input:
    - n_cols: number of columns in the figure
    - fig: figure to be modified. If None, the current figure is used.

    Assumptions: 
    - fig.axes should be ordered top to bottom (ascending row number). 
      So make sure the subplots have been added in this order. 
    - The upper-half's first subplot (column 0) should always be present

    Effect:
    - The spacing between vertical pairs is reduced to zero by moving all lower-half subplots up.

    Returns:
    - Modified fig
    """
    if fig is None:
        fig = plt.gcf()
    for ax in fig.axes:
        if hasattr(ax, 'get_subplotspec'):
            ss = ax.get_subplotspec()
            row, col = ss.num1 // n_cols, ss.num1 % n_cols
            if (row % 2 == 0) and (col == 0): # upper-half row (first subplot)
                y0_upper = ss.get_position(fig).y0
            elif (row % 2 == 1): # lower-half row (all subplots)
                x0_low, _ , width_low, height_low = ss.get_position(fig).bounds
                ax.set_position(pos=[x0_low, y0_upper - height_low, width_low, height_low])
    return fig


这是上述函数的测试:

def test_tight_pairs():

    def make_template(title):
        fig = plt.figure(figsize=(8, 6))
        for i in range(12):
            plt.subplot(6, 2, i+1)
            plt.plot([0,1], [0,1][::-1 if i%2==1 else 1])
        fig.suptitle(title)
        return fig
    
    make_template("The vertical spacing should have increased (disappeared) between (within) pairs.")
    tight_pairs(2)
    make_template("Default spacing.")
    plt.show()

test_tight_pairs()

额外说明:

  • 如果网格中的某些子图对缺失,例如“下三角形”排列的子图,则此方法也适用。
  • 为了在这些子图之间保持一定的距离,您可以通过以下方式添加一些填充:
    • y0_upper - height_low - padding,或者
    • y0_upper - height_low - p * height_low
  • 如果标签和y轴上的刻度重叠,则可能需要进行一些修复。

网页内容由stack overflow 提供, 点击上面的
可以查看英文原文,
原文链接