我正在尝试使用matplotlib创建一个包含12个图的图形。
这些图分布如下:有3列和4行。我希望前两行在y轴/垂直方向上“粘”在一起,即它们之间不应该有坐标轴标签和下面一行的图形标题。第3行和第4行也是如此。但是,我希望在两个“行组”之间留出一些空间。因此,基本上第1行和第2行粘在一起,第3行和第4行粘在一起,但第2行和第3行之间有一些空间。
我只能找到影响所有子图高度空间的参数,但没有让我单独修改高度空间的参数。在这个MWE中,我使用“figure.subplot.hspace”rcParam来修改hspace。
我只能找到影响所有子图高度空间的参数,但没有让我单独修改高度空间的参数。在这个MWE中,我使用“figure.subplot.hspace”rcParam来修改hspace。
#!/usr/bin/env python3

import matplotlib as mpl
from matplotlib import pyplot as plt
import numpy as np

params = {
    "xtick.labelsize": 12,
    "ytick.labelsize": 12,
    "xtick.direction": "in",
    "ytick.direction": "in",
    "xtick.top": True,
    "ytick.right": True,
    "figure.subplot.left": 0.045,
    "figure.subplot.right": 0.99,
    "figure.subplot.bottom": 0.05,
    "figure.subplot.top": 0.93,
    "figure.subplot.wspace": 0.15,
    "figure.subplot.hspace": 0.0,
}
mpl.rcParams.update(params)


if __name__ == "__main__":

    # invent some data
    x = np.linspace(0, 2*np.pi, 100)
    y_main = np.sin(x)
    y_diff = 1. - y_main


    fig = plt.figure(figsize=(18, 22))
    ax1 = fig.add_subplot(4,3,1,)
    ax2 = fig.add_subplot(4,3,2,)
    ax3 = fig.add_subplot(4,3,3,)
    ax1_sub = fig.add_subplot(4,3,4)
    ax2_sub = fig.add_subplot(4,3,5)
    ax3_sub = fig.add_subplot(4,3,6)
    ax4 = fig.add_subplot(4,3,7,)
    ax5 = fig.add_subplot(4,3,8,)
    ax6 = fig.add_subplot(4,3,9,)
    ax4_sub = fig.add_subplot(4,3,10)
    ax5_sub = fig.add_subplot(4,3,11)
    ax6_sub = fig.add_subplot(4,3,12)


    subaxes = [ax1_sub, ax2_sub, ax3_sub, ax4_sub, ax5_sub, ax6_sub]
    mainaxes = [ax1, ax2, ax3, ax4, ax5, ax6]

    for ax in mainaxes:
        ax.set_title("Title")
        ax.plot(x, y_main)
        ax.set_ylabel("y(x)")
        ax.tick_params(labelbottom=False)

    for ax in subaxes:
        ax.plot(x, y_diff)
        ax.set_xlabel("xlabel")
        ax.set_ylabel("1 - y(x)")


    #  plt.tight_layout()
    plt.savefig("mwe.png", dpi=200)
    plt.close()
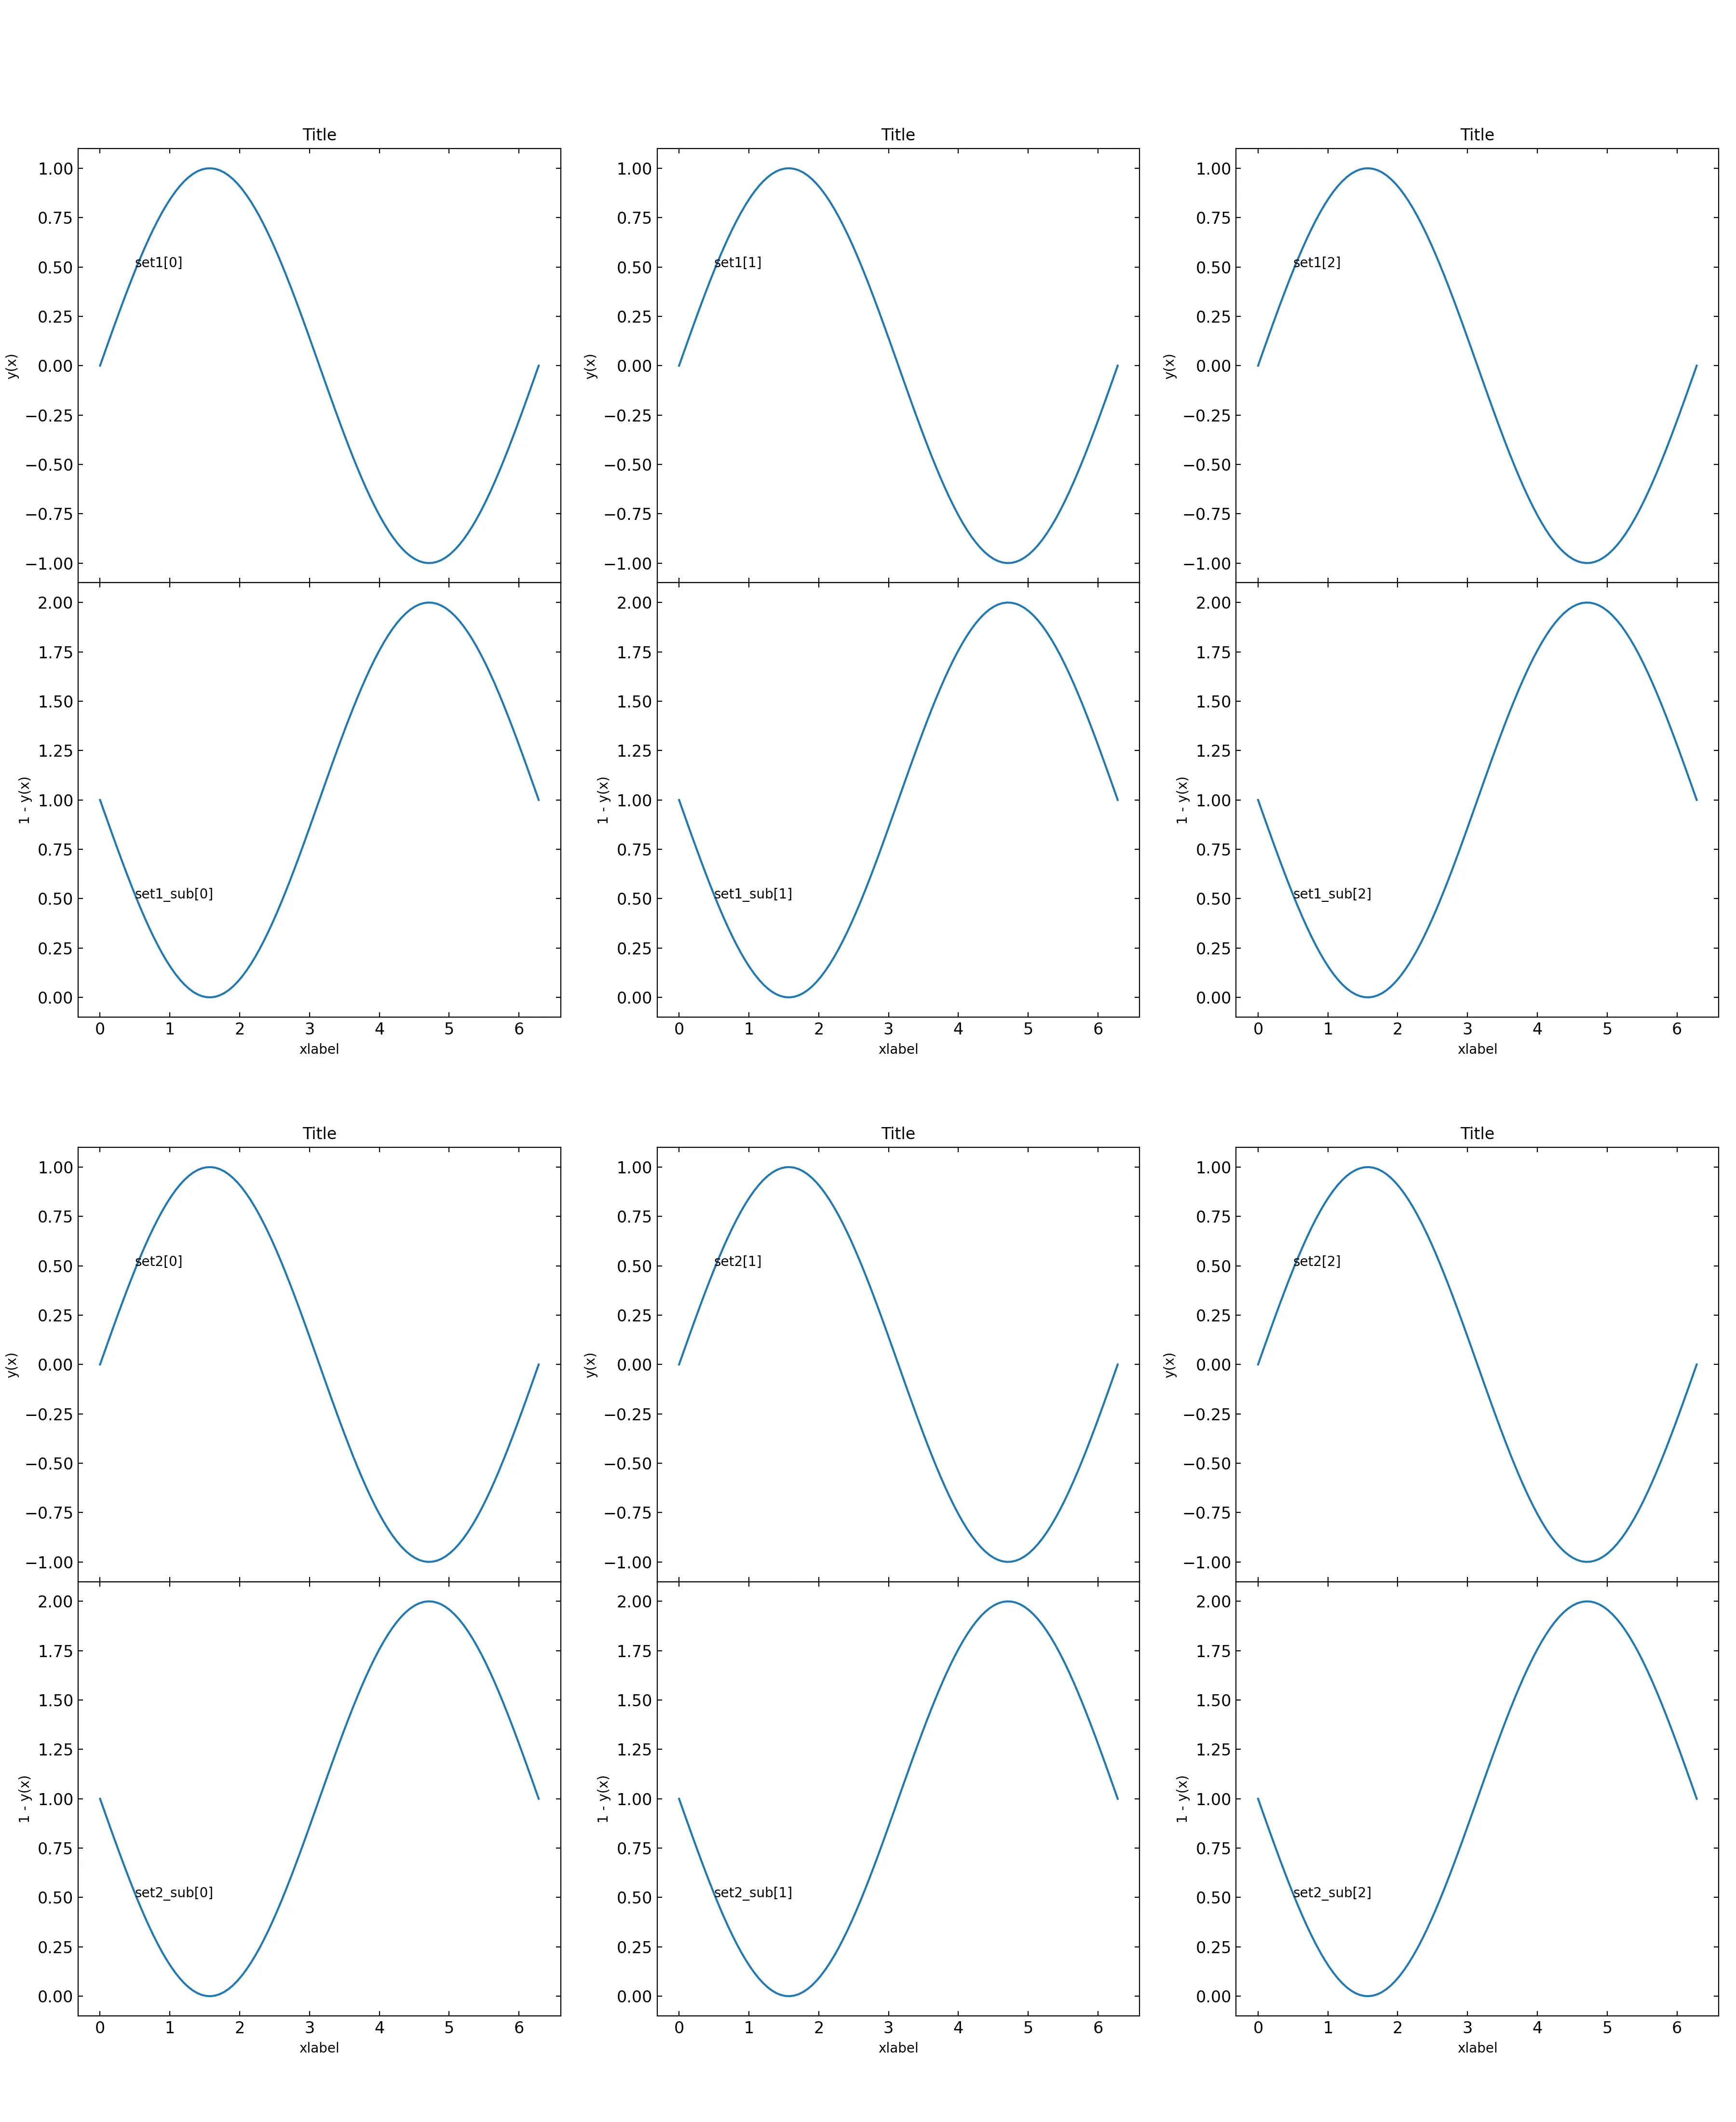
结果如下图所示:
这正是我想要让第1&2行和第3&4行“粘在一起”的方式。但是,正如您所看到的,轴标签和图形标题现在分别丢失和位于其他图形内。
我该如何仅在两个特定行之间添加一些空间?