如何在3D子图之间连接点

3

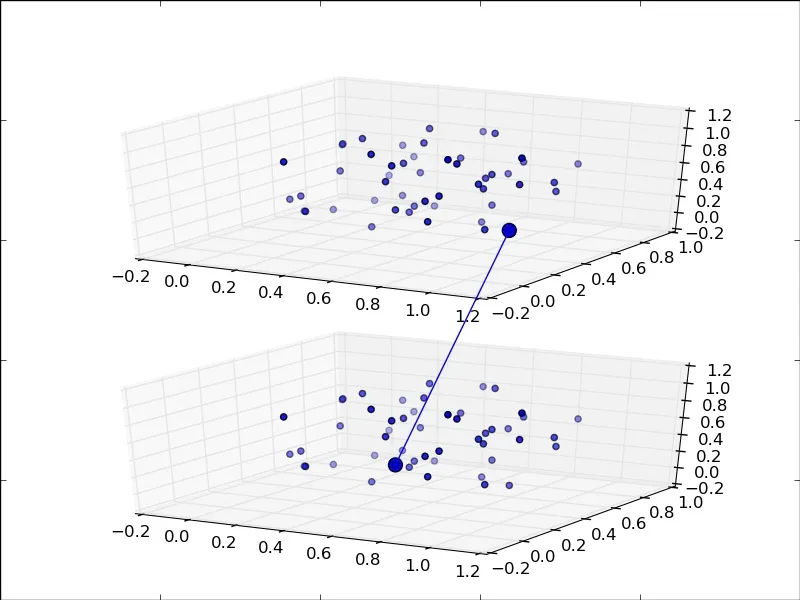
尝试在3D子图上连接一个点到另一个3D子图的线。在2D中,使用ConnectionPatch很容易实现。我尝试模仿这里的Arrow3D类,但没有成功。

目前,即使只有一个解决方法,我也会感到高兴。例如,在下面代码生成的图中,我想连接两个绿点。

def cylinder(r, n):
    '''
    Returns the unit cylinder that corresponds to the curve r.
    INPUTS:  r - a vector of radii
             n - number of coordinates to return for each element in r

    OUTPUTS: x,y,z - coordinates of points
    '''

    # ensure that r is a column vector
    r = np.atleast_2d(r)
    r_rows, r_cols = r.shape

    if r_cols > r_rows:
        r = r.T

    # find points along x and y axes
    points = np.linspace(0, 2*np.pi, n+1)
    x = np.cos(points)*r
    y = np.sin(points)*r

    # find points along z axis
    rpoints = np.atleast_2d(np.linspace(0, 1, len(r)))
    z = np.ones((1, n+1))*rpoints.T

    return x, y, z


#---------------------------------------
# 3D example
#---------------------------------------
fig = plt.figure()

# top figure
ax = fig.add_subplot(2,1,1, projection='3d')
x,y,z = cylinder(np.linspace(2,1,num=10), 40)
for i in range(len(z)):
    ax.plot(x[i], y[i], z[i], 'c')
ax.plot([2], [0], [0],'go')

# bottom figure
ax2 = fig.add_subplot(2,1,2, projection='3d')
x,y,z = cylinder(np.linspace(0,1,num=10), 40)
for i in range(len(z)):
    ax2.plot(x[i], y[i], z[i], 'r')
ax2.plot([1], [0], [1],'go')

plt.show()
3个回答

4
我今晚也尝试解决一个非常类似的问题!其中一些代码可能是不必要的,但它会给你主要的想法... ...我希望。
灵感来自:http://hackmap.blogspot.com.au/2008/06/pylab-matplotlib-imagemap.html和其他许多不同的来源,在过去的两个小时里...
#! /usr/bin/env python

import numpy as np
import matplotlib.pyplot as plt
from mpl_toolkits.mplot3d import Axes3D
from mpl_toolkits.mplot3d import proj3d
import matplotlib

N = 50
x = np.random.rand(N)
y = np.random.rand(N)
z = np.random.rand(N)

# point's to join
p1 = 10
p2 = 20

fig = plt.figure()

# a background axis to draw lines on
ax0 = plt.axes([0.,0.,1.,1.])
ax0.set_xlim(0,1)
ax0.set_ylim(0,1)

# use these to know how to transform the screen coords
dpi = ax0.figure.get_dpi()
height = ax0.figure.get_figheight() * dpi
width = ax0.figure.get_figwidth() * dpi

# first scatter plot
ax1 = plt.axes([0.05,0.05,0.9,0.425], projection='3d')
ax1.scatter(x, y, z)

# one point of interest
ax1.scatter(x[p1], y[p1], z[p1], s=100.)
x1, y1, _ = proj3d.proj_transform(x[p1], y[p1], z[p1], ax1.get_proj())
[x1,y1] = ax1.transData.transform((x1, y1))  # convert 2d space to screen space
# put them in screen space relative to ax0
x1 = x1/width
y1 = y1/height

# second scatter plot (same data)
ax2 = plt.axes([0.05,0.475,0.9,0.425], projection='3d')
ax2.scatter(x, y, z)

# another point of interest
ax2.scatter(x[p2], y[p2], z[p2], s=100.)
x2, y2, _ = proj3d.proj_transform(x[p2], y[p2], z[p2], ax2.get_proj())
[x2,y2] = ax2.transData.transform((x2, y2))  # convert 2d space to screen space
x2 = x2/width
y2 = y2/height


# set all these guys to invisible (needed?, smartest way?)
for item in [fig, ax1, ax2]:
    item.patch.set_visible(False)

# draw a line between the transformed points
# again, needed? I know it works...

transFigure = fig.transFigure.inverted()

coord1 = transFigure.transform(ax0.transData.transform([x1,y1]))
coord2 = transFigure.transform(ax0.transData.transform([x2,y2]))

line = matplotlib.lines.Line2D((coord1[0],coord2[0]),(coord1[1],coord2[1]),
                               transform=fig.transFigure)
fig.lines = line,

plt.show()

success


太棒了!我把我的代码放在下面。它清理了一些你的代码中的行,但大部分都是相同的。谢谢! - benten

0

这是我的最终代码,只是为了提供一个可行的示例:

#! /usr/bin/env python

import numpy as np
import matplotlib.pyplot as plt
import mpl_toolkits.mplot3d.axes3d as p3
from mpl_toolkits.mplot3d import Axes3D
from mpl_toolkits.mplot3d import proj3d
import matplotlib


def cylinder(r, n):
    '''
    Returns the unit cylinder that corresponds to the curve r.
    INPUTS:  r - a vector of radii
             n - number of coordinates to return for each element in r

    OUTPUTS: x,y,z - coordinates of points
    '''

    # ensure that r is a column vector
    r = np.atleast_2d(r)
    r_rows, r_cols = r.shape

    if r_cols > r_rows:
        r = r.T

    # find points along x and y axes
    points = np.linspace(0, 2*np.pi, n+1)
    x = np.cos(points)*r
    y = np.sin(points)*r

    # find points along z axis
    rpoints = np.atleast_2d(np.linspace(0, 1, len(r)))
    z = np.ones((1, n+1))*rpoints.T

    return x, y, z


#---------------------------------------
# 3D example
#---------------------------------------
fig = plt.figure()

# a background axis to draw lines on
ax0 = plt.axes([0.,0.,1.,1.])
ax0.set_xlim(0,1)
ax0.set_ylim(0,1)

# use these to know how to transform the screen coords
dpi = ax0.figure.get_dpi()
height = ax0.figure.get_figheight() * dpi
width = ax0.figure.get_figwidth() * dpi


# top figure
ax1 = fig.add_subplot(2,1,1, projection='3d')
x,y,z = cylinder(np.linspace(2,1,num=10), 40)
for i in range(len(z)):
    ax1.plot(x[i], y[i], z[i], 'c')


# bottom figure
ax2 = fig.add_subplot(2,1,2, projection='3d')
x,y,z = cylinder(np.linspace(0,1,num=10), 40)
for i in range(len(z)):
    ax2.plot(x[i], y[i], z[i], 'r')


# first point of interest
p1 = ([2],[0],[0])
ax1.plot(p1[0], p1[1], p1[2],'go')
x1, y1, _ = proj3d.proj_transform(p1[0], p1[1], p1[2], ax1.get_proj())
[x1,y1] = ax1.transData.transform((x1[0], y1[0]))  # convert 2d space to screen space
# put them in screen space relative to ax0
x1 = x1/width
y1 = y1/height

# another point of interest
p2 = ([1], [0], [1])
ax2.plot(p2[0], p2[1], p2[2],'go')
x2, y2, _ = proj3d.proj_transform(p2[0], p2[1], p2[2], ax2.get_proj())
[x2,y2] = ax2.transData.transform((x2[0], y2[0]))  # convert 2d space to screen space
x2 = x2/width
y2 = y2/height

# plot line between subplots
transFigure = fig.transFigure.inverted()
coord1 = transFigure.transform(ax0.transData.transform([x1,y1]))
coord2 = transFigure.transform(ax0.transData.transform([x2,y2]))
fig.lines = ax0.plot((coord1[0],coord2[0]),(coord1[1],coord2[1]), transform=fig.transFigure, linestyle='dashed' )

plt.show()

0

为了修复连接点的轻微移动,
fig.canvas.draw()fig.savefig('…')可能会起作用。

在我的环境(pydroid)中,使用plt.show()显示图形时,点和线边缘的坐标不匹配,可能是因为pydroid中的交互式后端自动更改了图形大小,然后移动了线条。因此,我使用fig.savefig('…')代替了plt.show()

ax.set_xlim(…,…)等之后,在proj3d.proj_transform之前插入fig.canvas.draw()也可以起作用。

fig

我的代码如下。

import matplotlib.pyplot as plt
from mpl_toolkits.mplot3d import Axes3D
from mpl_toolkits.mplot3d import proj3d
import  matplotlib


fig = plt.figure(figsize = (10, 12), dpi=100)

ax0 = plt.axes([0.,0.,1.,1.])
ax0.set_xlim(0,1)
ax0.set_ylim(0,1)


ax0.figure.set_dpi(100)
dpi = ax0.figure.get_dpi()
height = ax0.figure.get_figheight() * dpi
width = ax0.figure.get_figwidth() * dpi


ax1 = fig.add_subplot(2,2,1, projection='3d')
ax2 = fig.add_subplot(2,2,2, projection='3d')


p1 = [-2, 0, 0.5]
ax1.plot(p1[0], p1[1], p1[2],'go')
p2 = [0, 2, 1]
ax2.plot(p2[0], p2[1], p2[2],'go')

ax1.set_xlim(-2,2)
ax1.set_ylim(-2,2)
ax1.set_zlim(0,1)
ax2.set_xlim(-2,2)
ax2.set_ylim(-2,2)
ax2.set_zlim(0,1)


# fig.canvas.draw()


x1, y1, _ = proj3d.proj_transform(p1[0], p1[1], p1[2], ax1.get_proj())
[x1,y1] = ax1.transData.transform((x1, y1))
x1 = x1/width
y1 = y1/height

x2, y2, _ = proj3d.proj_transform(p2[0], p2[1], p2[2], ax2.get_proj())
[x2,y2] = ax2.transData.transform((x2, y2))
x2 = x2/width
y2 = y2/height

transFigure = fig.transFigure.inverted()
coord1 = transFigure.transform(ax0.transData.transform([x1,y1]))
coord2 = transFigure.transform(ax0.transData.transform([x2,y2]))
line1 = matplotlib.lines.Line2D((coord1[0],coord2[0]),(coord1[1],coord2[1]), transform=fig.transFigure, linestyle='dashed' )


ax3 = fig.add_subplot(2,2,3, projection='3d')
ax4 = fig.add_subplot(2,2,4, projection='3d')

ax3.plot(p1[0], p1[1], p1[2],'go')
ax4.plot(p2[0], p2[1], p2[2],'go')

ax3.set_xlim(-2,2)
ax3.set_ylim(-2,2)
ax3.set_zlim(0,1)
ax4.set_xlim(-2,2)
ax4.set_ylim(-2,2)
ax4.set_zlim(0,1)


fig.canvas.draw() 


x1, y1, _ = proj3d.proj_transform(p1[0], p1[1], p1[2], ax3.get_proj())
[x1,y1] = ax3.transData.transform((x1, y1))
x1 = x1/width
y1 = y1/height

x2, y2, _ = proj3d.proj_transform(p2[0], p2[1], p2[2], ax4.get_proj())
[x2,y2] = ax4.transData.transform((x2, y2))
x2 = x2/width
y2 = y2/height

transFigure = fig.transFigure.inverted()
coord1 = transFigure.transform(ax0.transData.transform([x1,y1]))
coord2 = transFigure.transform(ax0.transData.transform([x2,y2]))

line2= matplotlib.lines.Line2D((coord1[0],coord2[0]),(coord1[1],coord2[1]), transform=fig.transFigure, linestyle='dashed' )


fig.lines = line1, line2


ax0.text(0.2, 0.88, "Not good.", fontsize=30)
ax0.text(0.2, 0.44, "Good!", fontsize=30)

plt.savefig("fig.png",dpi=100)


网页内容由stack overflow 提供, 点击上面的
可以查看英文原文,
原文链接