matlibplot:如何在某些子图之间添加空间

4

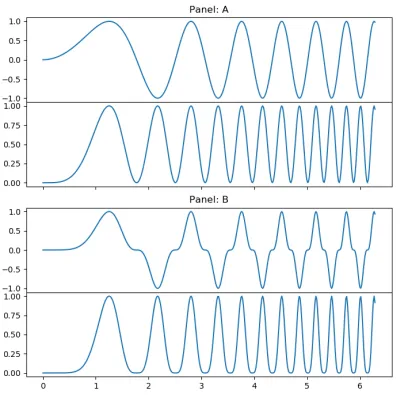
我该如何调整一些子图之间的空白?在下面的示例中,假设我想消除第1个和第2个子图之间以及第3个和第4个子图之间的所有空白,并增加第2个和第3个子图之间的间距?

import matplotlib.pyplot as plt
import numpy as np

# Simple data to display in various forms
x = np.linspace(0, 2 * np.pi, 400)
y = np.sin(x ** 2)

f, ax = plt.subplots(4,figsize=(10,10),sharex=True)

ax[0].plot(x, y)
ax[0].set_title('Panel: A')

ax[1].plot(x, y**2)

ax[2].plot(x, y**3)
ax[2].set_title('Panel: B')
ax[3].plot(x, y**4)

plt.tight_layout() 
2个回答

8
为了让解决方案与您的代码更接近,您可以创建5个子图,其中中间一个的高度是其他子图的四分之一,并删除该中间子图。
import matplotlib.pyplot as plt
import numpy as np

# Simple data to display in various forms
x = np.linspace(0, 2 * np.pi, 400)
y = np.sin(x ** 2)

f, ax = plt.subplots(5,figsize=(7,7),sharex=True, 
                     gridspec_kw=dict(height_ratios=[4,4,1,4,4], hspace=0))

ax[0].plot(x, y)
ax[0].set_title('Panel: A')

ax[1].plot(x, y**2)

ax[2].remove()

ax[3].plot(x, y**3)
ax[3].set_title('Panel: B')
ax[4].plot(x, y**4)


plt.tight_layout()
plt.show()

enter image description here


6

如果需要在绘图之间设置不同的空间,您需要使用GridSpec

import matplotlib.pyplot as plt
import matplotlib.gridspec as gridspec
import numpy as np

# Simple data to display in various forms
x = np.linspace(0, 2 * np.pi, 400)
y = np.sin(x ** 2)

f = plt.figure(figsize=(10,10))
gs0 = gridspec.GridSpec(2, 1)

gs00 = gridspec.GridSpecFromSubplotSpec(2, 1, subplot_spec=gs0[0], hspace=0)
ax0 = f.add_subplot(gs00[0])
ax0.plot(x, y)
ax0.set_title('Panel: A')
ax1 = f.add_subplot(gs00[1], sharex=ax0)
ax1.plot(x, y**2)

gs01 = gridspec.GridSpecFromSubplotSpec(2, 1, subplot_spec=gs0[1], hspace=0)
ax2 = f.add_subplot(gs01[0])
ax2.plot(x, y**3)
ax2.set_title('Panel: B')
ax3 = f.add_subplot(gs01[1], sharex=ax0)
ax3.plot(x, y**4)

plt.show()

enter image description here


网页内容由stack overflow 提供, 点击上面的
可以查看英文原文,
原文链接