我正在使用ggvis生成一个图表,但是图例重叠在一起。
library(ggvis)
df1 <- data.frame(x=c(0.6,1,1.4), y=c(-2, -.8, -0.2), number=c(10,8,6),
                  type=c('A', 'A', 'B'))
df1 %>% ggvis(x = ~x, y = ~y) %>%
  layer_points(shape=~type, fill=~number)
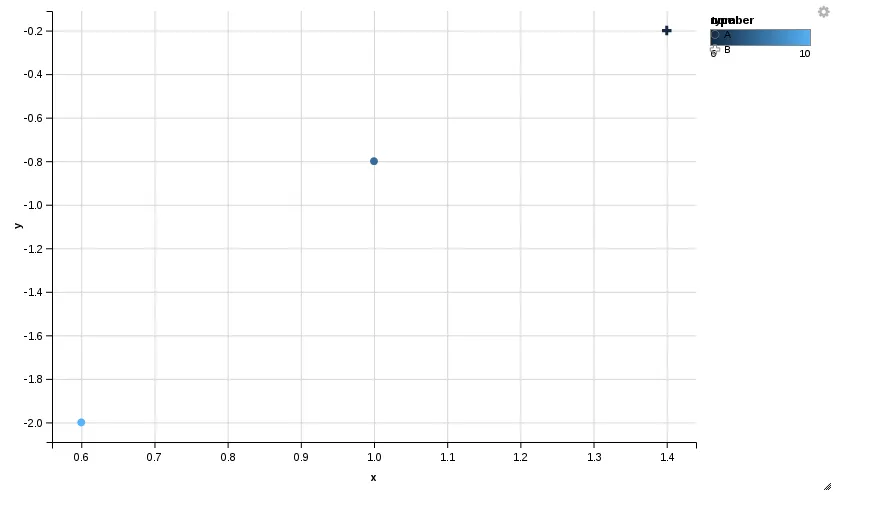
我该怎么解决这个问题?
谢谢!
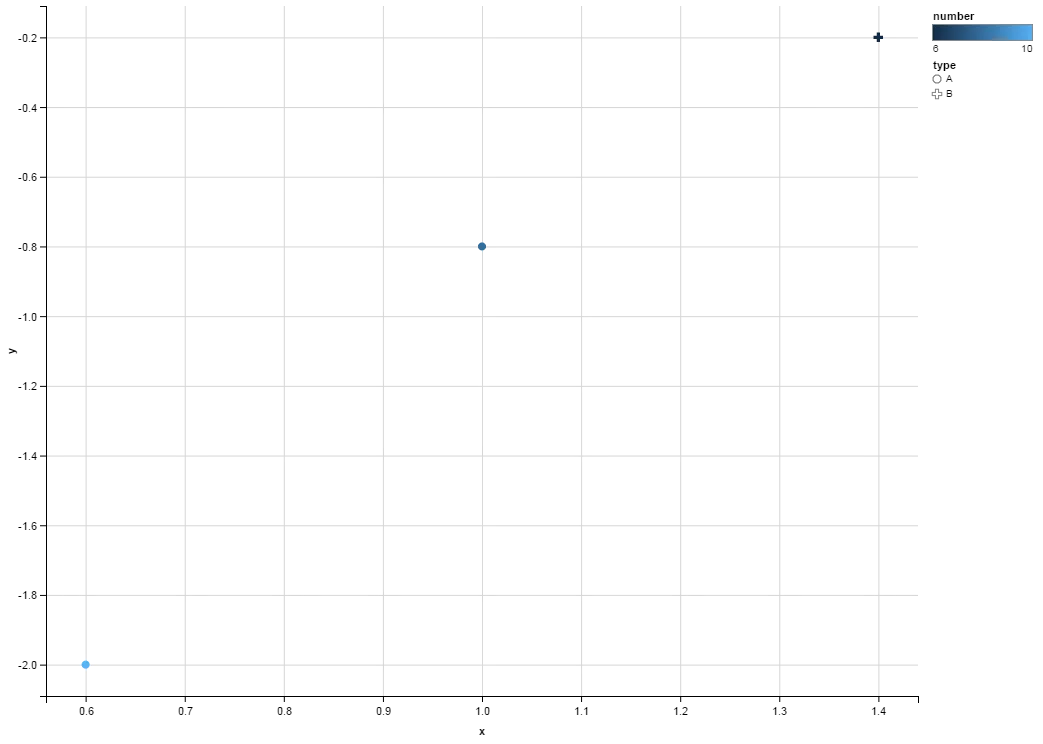
Steven的方案对于简单的示例有效,但是当添加一个工具提示时它不起作用:
library(ggvis)
df1 <- data.frame(x=c(0.6,1,1.4), y=c(-2, -.8, -0.2), number=c(10,8,6),
                  type=c('A', 'A', 'B'), id=c(1:3))

tooltip <- function(x) {
  if(is.null(x)) return(NULL)
  row <- df1[df1$id == x$id, ]
  paste0(names(row), ": ", format(row), collapse = "<br />")
}

df1 %>% ggvis(x = ~x, y = ~y) %>%
  layer_points(shape=~type, fill=~number, key := ~id)  %>%
  add_tooltip(tooltip, "hover") %>%
  add_legend("shape", properties = legend_props(legend = list(y = 50)))
set_options(duration = 0)可能有助于添加工具提示。请参见 github issue #125 中的讨论。 - aosmithggvis来说,现在还是早期阶段 ;) - Steven Beaupré