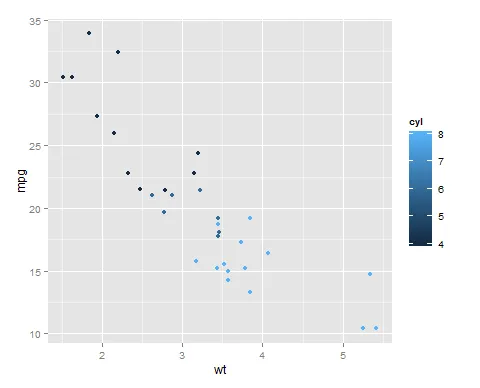
ggvis中图例的方向设置

3
在ggvis中如何使图例垂直显示?
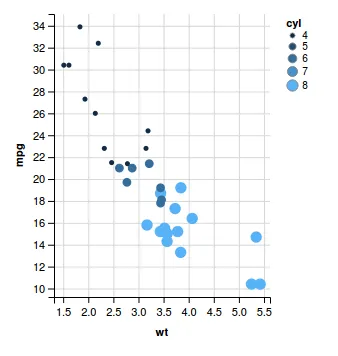
mtcars %>% ggvis(x = ~wt, y = ~mpg, fill = ~cyl) %>%
layer_points() %>%
add_legend("fill",properties = legend_props( legend = list(x = 500, y = 50)))

它将图例水平排列,我希望它垂直排列。
1个回答

3
请尝试以下代码:

mtcars %>% ggvis(~wt, ~mpg, size = ~cyl, fill = ~cyl) %>% layer_points() %>% add_legend(c("size", "fill"))

输出图表:

enter image description here

希望这可以帮到您。

编辑:

我探索了add_legend属性,不幸的是我现在没有看到使用ggvis实现垂直连续比例尺图例的任何方法,但可以使用ggplot2实现。

R代码:

ggplot(mtcars, aes(wt, mpg, color = cyl))+geom_point()

输出图表:

输入图片描述


@d.putto,我已经编辑了答案,希望这可以帮到你。 - Manohar Swamynathan

网页内容由stack overflow 提供, 点击上面的
可以查看英文原文,
原文链接