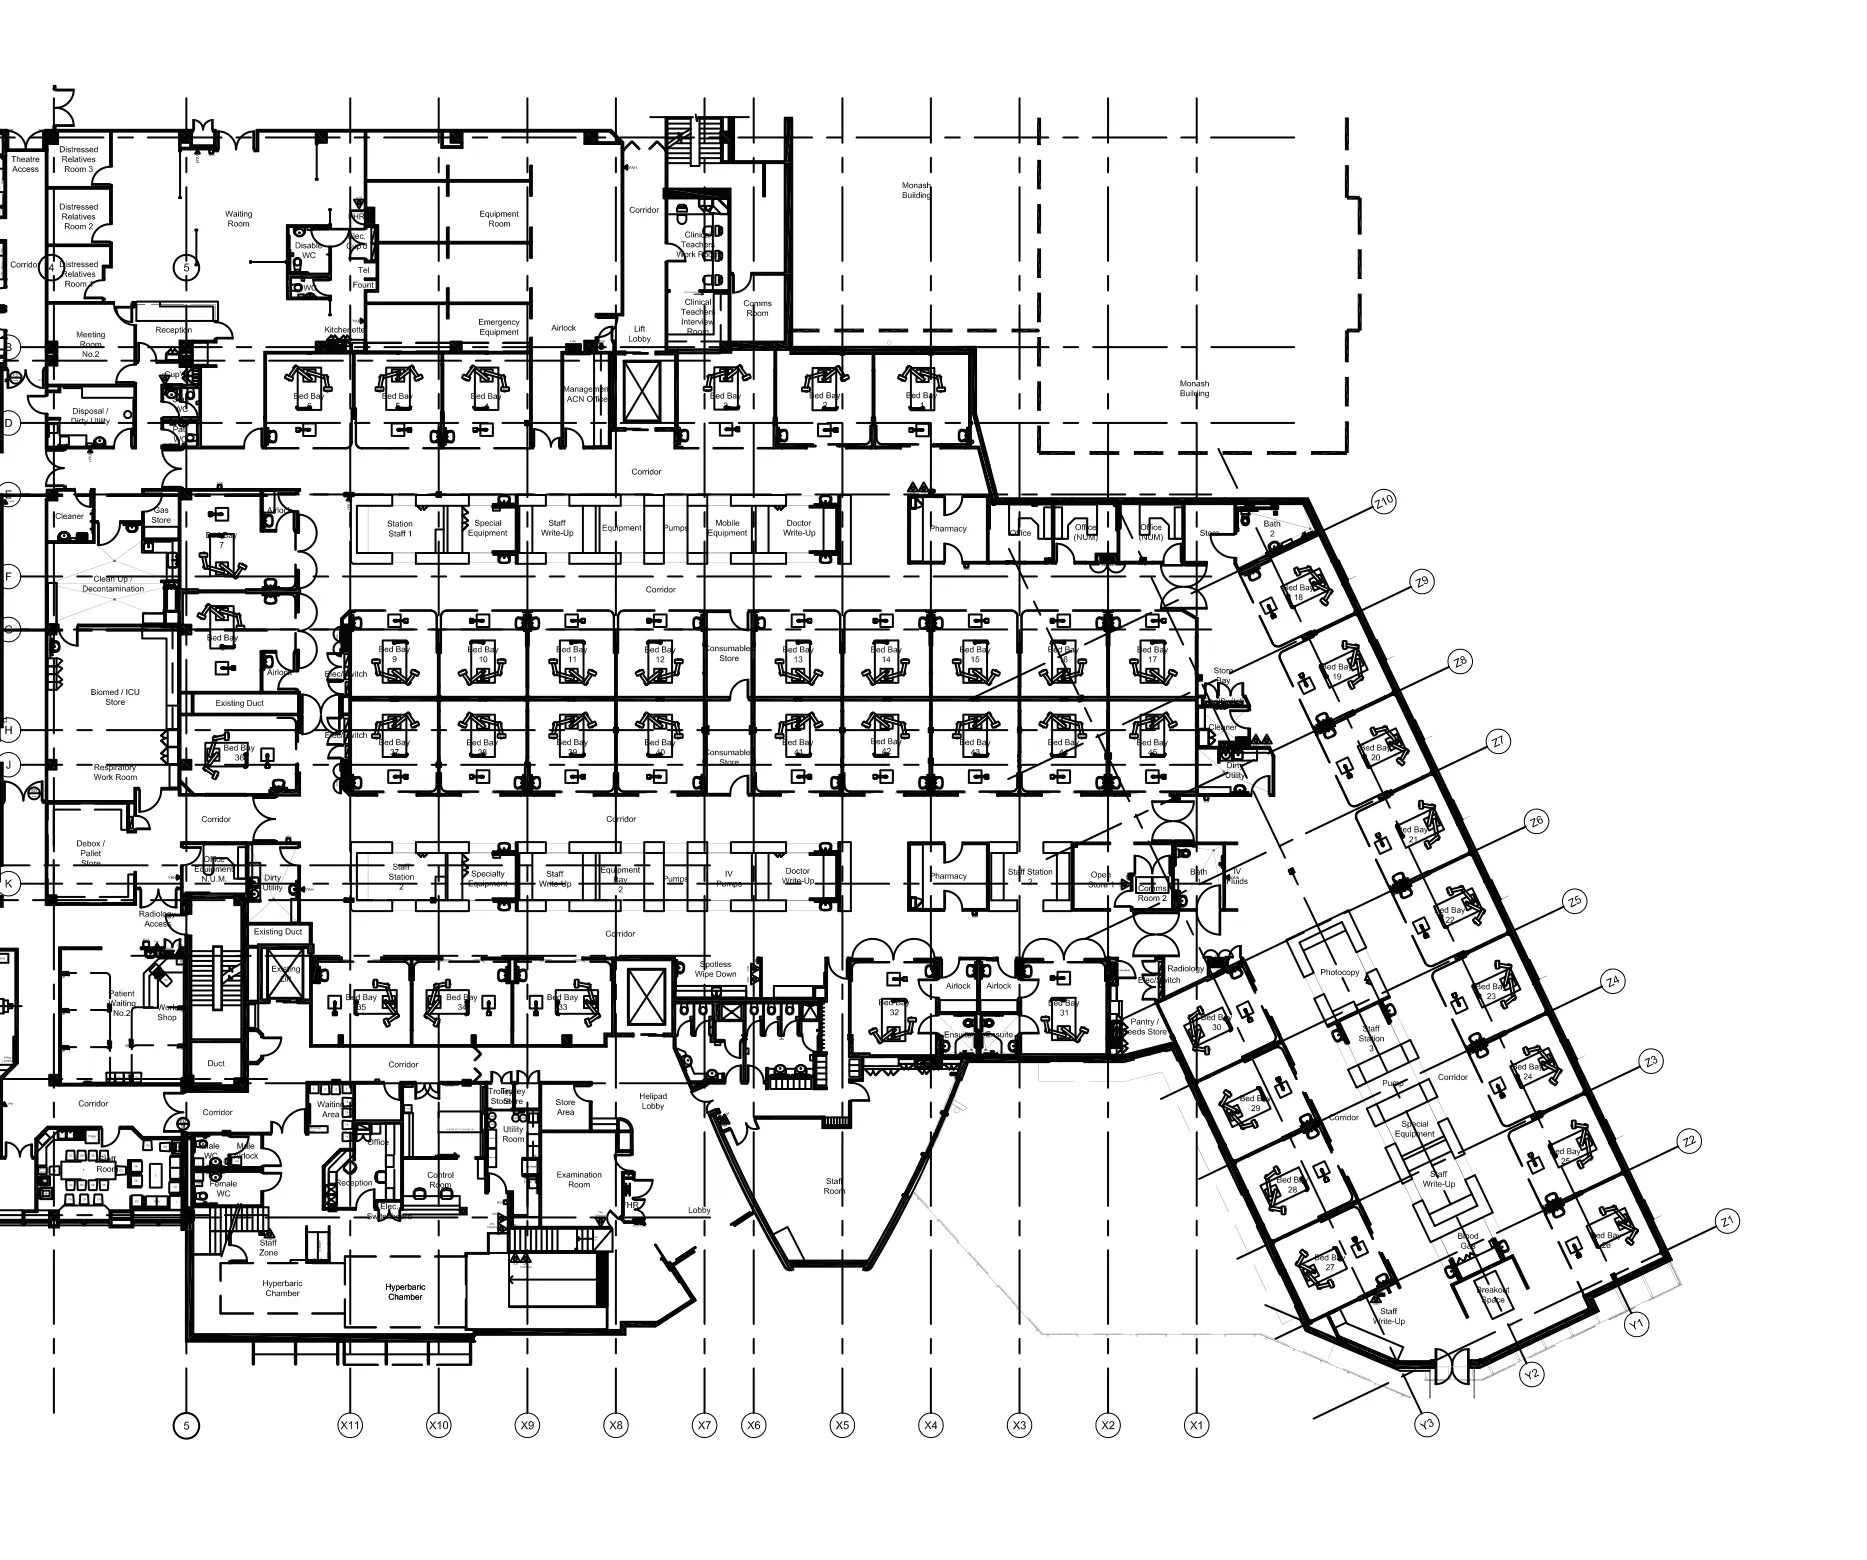
我想使用ggplot2将OHS事件映射到医院楼层平面图上。我已经尝试将这张非地理地图读入ggimage中。
到目前为止,我已经尝试了以下方法来处理我拥有的数据集(14462个观测值)。
示例数据集
toy <- data.frame(patient_ID = c(1001,1001,1002,1003,1004),
               SEX = c("M","M","F","F","F"),
              phenotype = c("Psychiatric","Psychiatric", "Cardio",
                            "Cancer","Psychiatric"),
                            x = c(0.5737, 0.5737, 0.6968, 0.4704, 0.6838),
                            y= c(0.3484, 0.3484, 0.62, 0.5216, 0.2486))
我尝试将文件作为光栅图读取,然后使用ggmaps,但困难在于没有图例。
library(ggmap)
library(png)
library(ggplot2)
library(data.table)

toy <- fread("toy.csv")

# read in image

r <- readPNG("ICU-crop.png")

#use ggimage to convert to plot and add gender
ggimage(r, scale_axes = TRUE) +
  geom_point(aes(x = x, y = y, colour = SEX), data = toy,
             size = I(1), fill = NA)
我希望能使用ggplot,但需要图例。我不确定在PNG上使用ggplot的其他方法。
