在R中使用ggplot绘制背景带

7
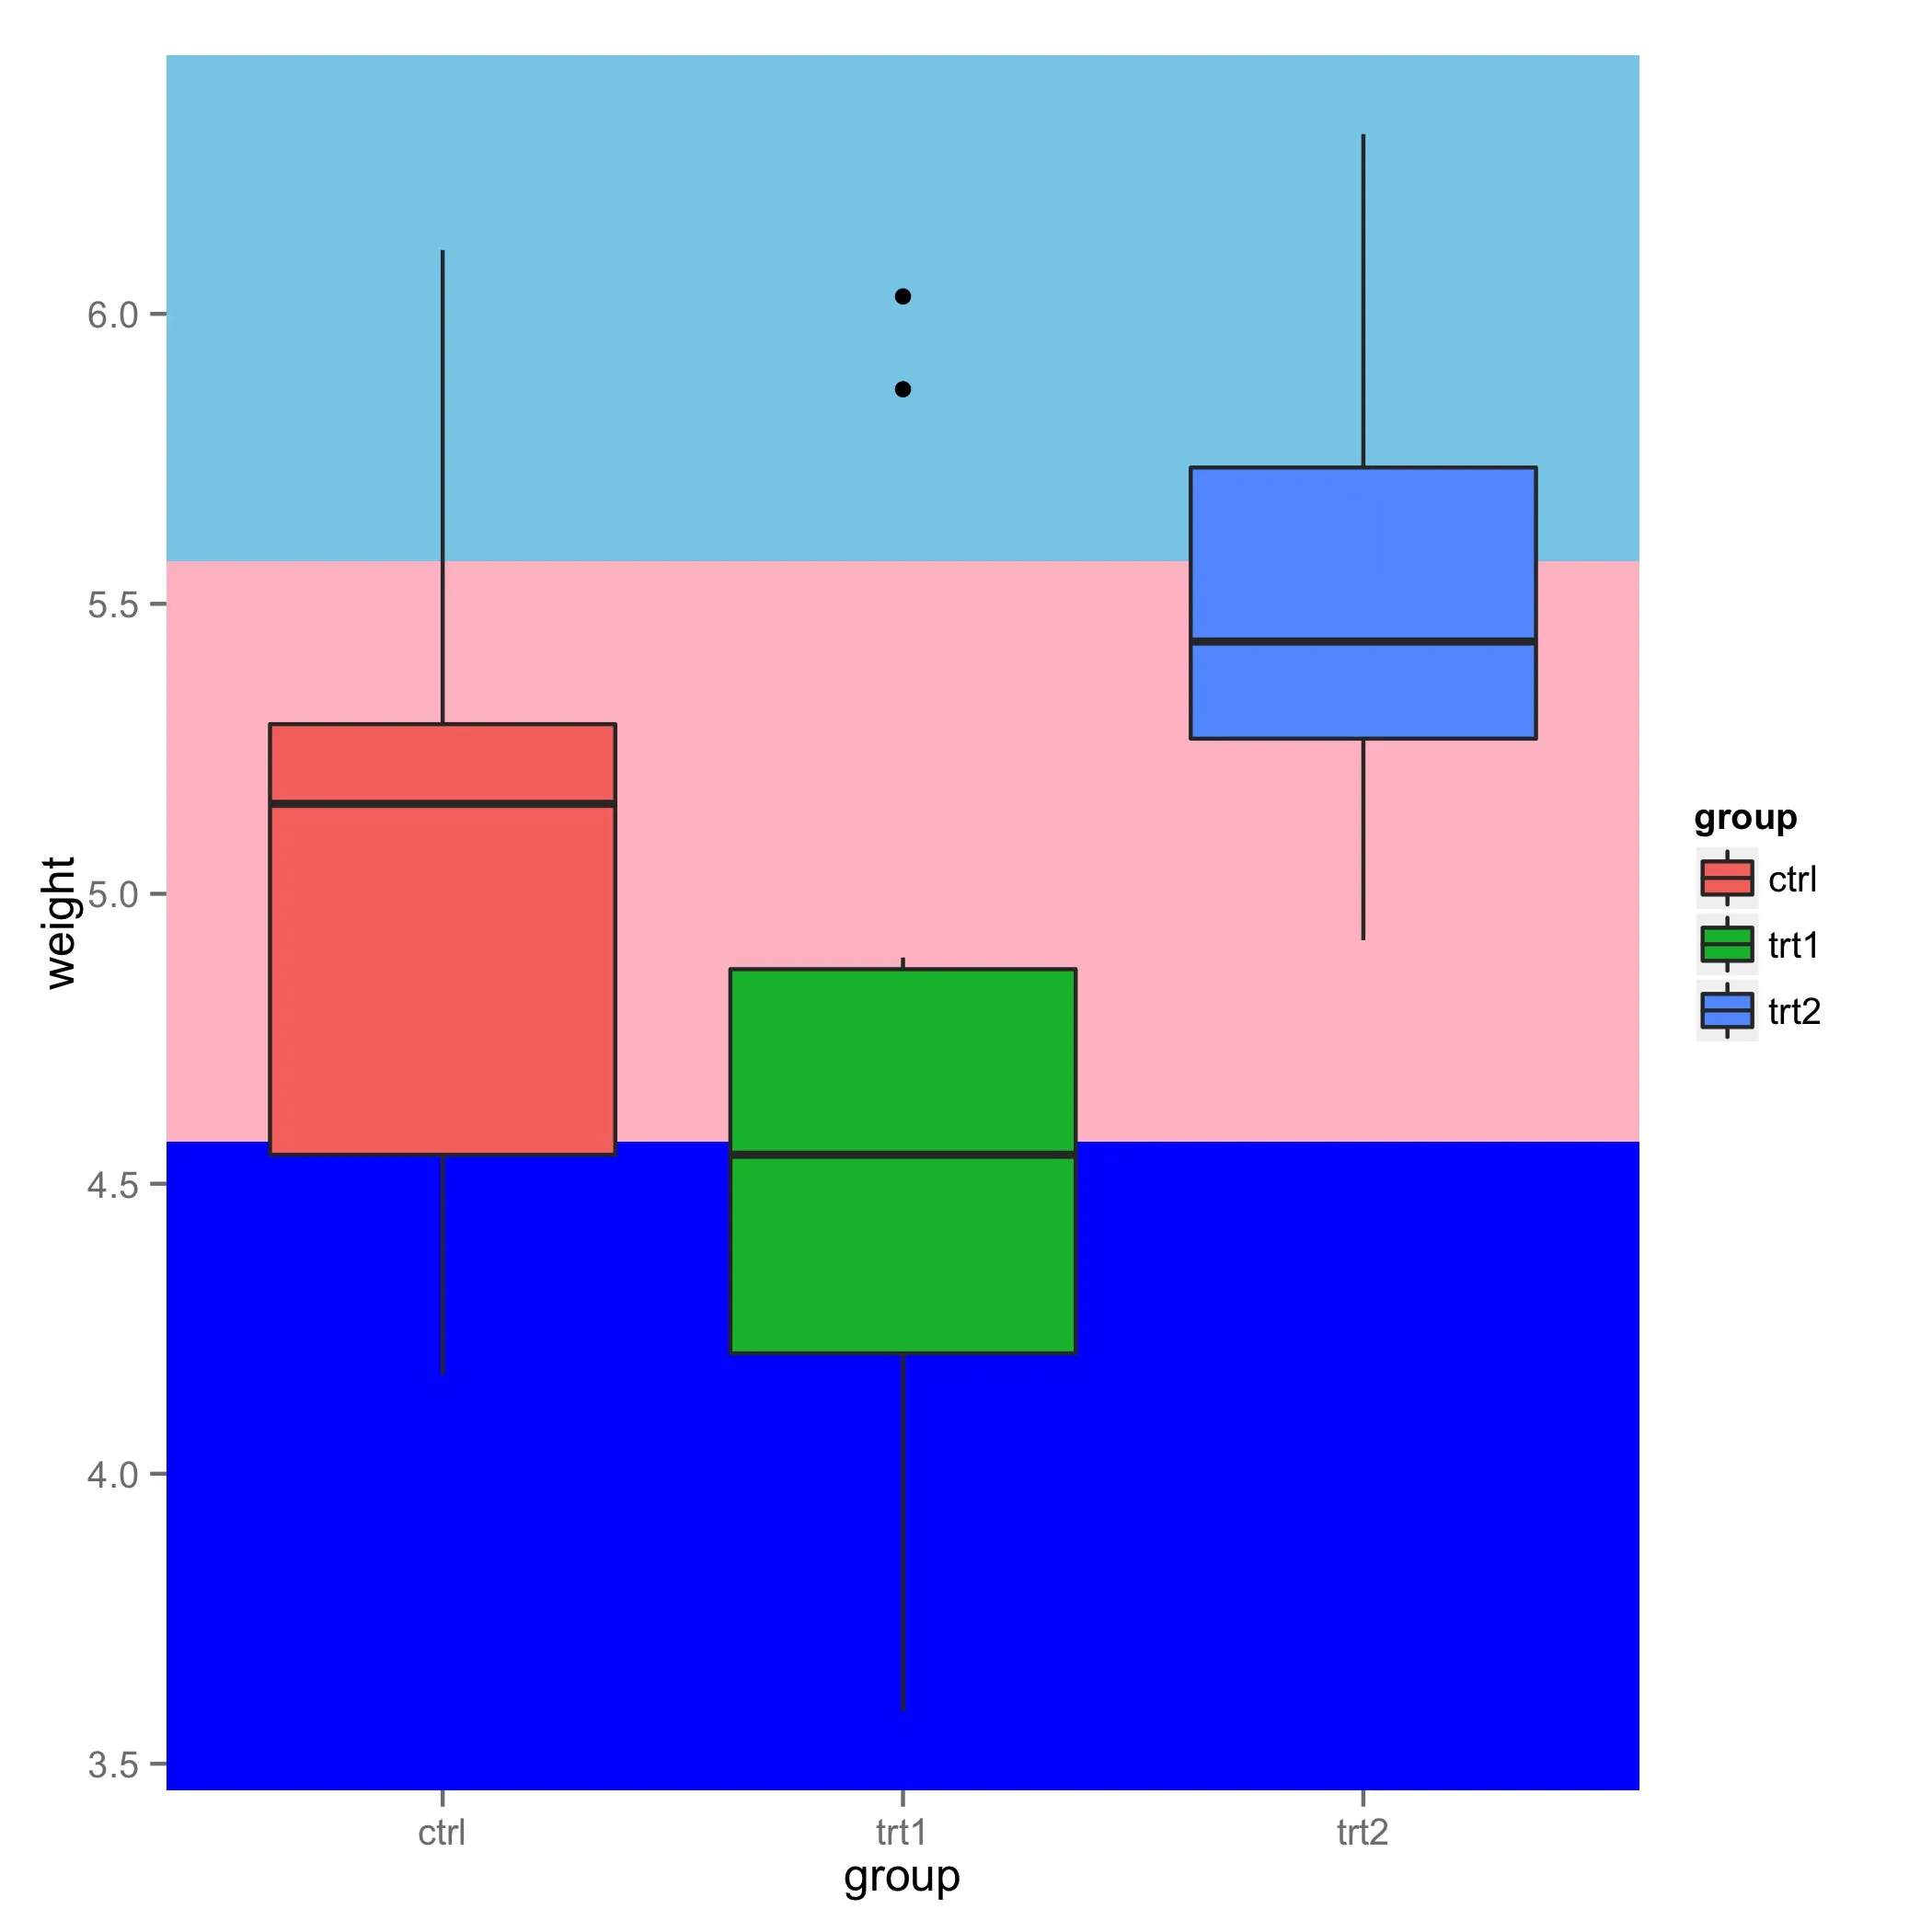
我正在尝试为不同的组创建箱线图。我想将背景颜色分为3个水平带。中间的那个带有所有靠近总体均值的观察值

平均重量 - 0.5 < x < 平均重量 + 0.5

另外两个带是下面和上面的。

这是我的图表

library(ggplot2)
bp <- ggplot(data=PlantGrowth, aes(x=group, y=weight, fill=group)) + geom_boxplot()
bp
1个回答

11

使用geom_rect

bp <- ggplot(data=PlantGrowth, aes(x=group, y=weight, fill=group)) +
    geom_rect(ymin = -Inf, ymax = lwWt, 
              xmin = -Inf, xmax = Inf, fill = 'blue') +
    geom_rect(ymin = lwWt, ymax = upWt, 
              xmin = -Inf, xmax = Inf, fill = 'pink') + 
    geom_rect(ymin = upWt, ymax = Inf, 
          xmin = -Inf, xmax = Inf, fill = 'skyblue') +
    geom_boxplot() 
print(bp)
ggsave("example.jpg", bp)

这将给您这个数字:enter image description here

希望您会改变背景颜色 :)


网页内容由stack overflow 提供, 点击上面的
可以查看英文原文,
原文链接