如何使用ggplot在R中绘制线图

3
我希望能制作一些按模型分割的线图。
以下是我的数据框代码:
Jumping = c(0.99,0.97,0.99,1,1)
Lunge = c(0.89,0.99,0.99 ,1,1)
Squat = c(0.97,0.99,0.99,1,1)
Stand = c(0.95,0.99, 1,1,1)
Standing_abs = c(1,0.97,0.99,0.99,0.97)
action = c("Jumping","Lunge","Squat","Stand","Standing_abs")
model = c("Knn","Dt","DNN","RF","rbf_SVM")

result = data.frame(Jumping,Lunge,Squat,Stand,Standing_abs,row.names = model)
result

和结果>

        Jumping Lunge Squat Stand Standing_abs
Knn        0.29  0.39  0.97  0.65         0.60
Dt         0.97  0.69  0.88  0.99         0.97
DNN        0.99  0.79  0.49  1.00         0.59
RF         1.00  0.77  1.00  0.91         0.39
rbf_SVM    1.00  1.00  1.00  0.58         0.97

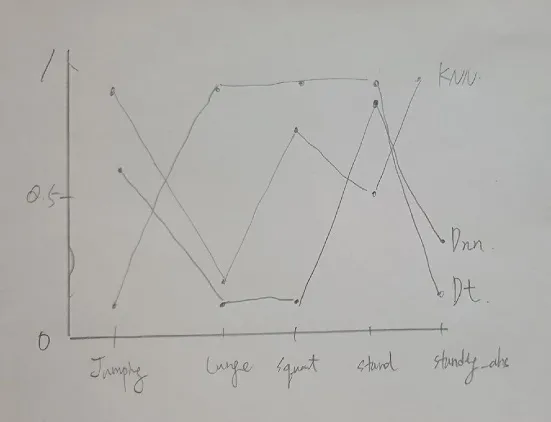
但是有一些问题。我想要的结果应该像...

enter image description here

如何制作分别由模型的图像的线图? 祝您拥有愉快的一天!

2
你需要先将数据转换为长格式。你需要有 ModelActivityValue 三列,以及 25 行数据。 - ziggystar
2个回答

4
require(rtidy)
require(ggplot2)

result %>% 
  add_rownames("model") %>% 
  gather("Activity","value",-model) %>% 
  ggplot(aes(x=Activity,y=value,color=model,group=model)) + geom_line()

enter image description here


3
你可以转置数据并使用 pivot_longer 来为每个模型创建行。
尝试执行以下操作:
library(tidyverse)
data <- t(result) %>% as.data.frame %>% 
                      rownames_to_column() %>%
                      pivot_longer(cols = rownames(result),names_to = "model")

ggplot(data) + geom_line(aes(group = model, x=rowname,y=value,color=model)) + xlab('Exercice')

enter image description here


网页内容由stack overflow 提供, 点击上面的
可以查看英文原文,
原文链接