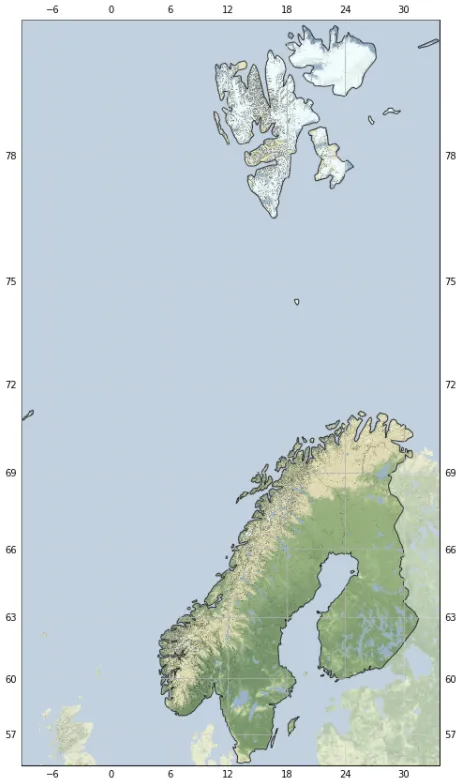
我正在使用以下代码来制作瑞典、挪威和芬兰的地图,将它们合并成一个区域。但是我遇到了一些困难。我正在遵循这个例子:Python Mapping in Matplotlib Cartopy Color One Country。
from shapely.geometry import Polygon
from cartopy.io import shapereader
import cartopy.io.img_tiles as cimgt
import cartopy.crs as ccrs
import geopandas
import matplotlib.pyplot as plt


def rect_from_bound(xmin, xmax, ymin, ymax):
    """Returns list of (x,y)'s for a rectangle"""
    xs = [xmax, xmin, xmin, xmax, xmax]
    ys = [ymax, ymax, ymin, ymin, ymax]
    return [(x, y) for x, y in zip(xs, ys)]

# request data for use by geopandas
resolution          = '10m'
category            = 'cultural'
name                = 'admin_0_countries'
countries           = ['Norway', 'Sweden', 'Finland']
shpfilename         = shapereader.natural_earth(resolution, category, name)
df                  = geopandas.read_file(shpfilename)
extent              = [2, 32, 55, 72]
# get geometry of a country
for country in (countries):
    poly = [df.loc[df['ADMIN'] == country]['geometry'].values[0]]
    stamen_terrain              = cimgt.StamenTerrain()
    # projections that involved
    st_proj = stamen_terrain.crs  #projection used by Stamen images
    ll_proj = ccrs.PlateCarree()  #CRS for raw long/lat
    # create fig and axes using intended projection
    fig = plt.figure(figsize=(8,9))
    ax = fig.add_subplot(122, projection=st_proj)
    ax.add_geometries(poly, crs=ll_proj, facecolor='none', edgecolor='black')
    pad1 = 0.5  #padding, degrees unit
    exts = [poly[0].bounds[0] - pad1, poly[0].bounds[2] + pad1, poly[0].bounds[1] - pad1, poly[0].bounds[3] + pad1];
    ax.set_extent(exts, crs=ll_proj)
    # make a mask polygon by polygon's difference operation
    # base polygon is a rectangle, another polygon is simplified switzerland
    msk = Polygon(rect_from_bound(*exts)).difference( poly[0].simplify(0.01) )
    msk_stm  = st_proj.project_geometry (msk, ll_proj)  # project geometry to the projection used by stamen
    # get and plot Stamen images
    ax.add_image(stamen_terrain, 8) # this requests image, and plot
    # plot the mask using semi-transparency (alpha=0.65) on the masked-out portion
    ax.add_geometries( msk_stm, st_proj, zorder=12, facecolor='white', edgecolor='none', alpha=0.65)
    ax.gridlines(draw_labels=True)
    plt.show()
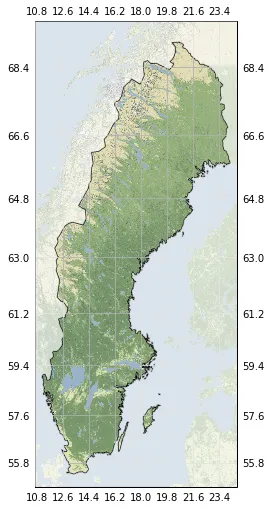
我手头有分开的地图,但是我只需要其中一张地图。
能帮忙吗?谢谢。