我尝试过Cartopy画廊中的这个示例,链接在此 (点击这里),它很好用。但我该如何聚焦于另一个国家,比如只展示德国呢?
我尝试了一些坐标放在extend()方法中,但是我没能让它看起来像美国地图一样。或者我需要修改shape文件吗?
图片链接在此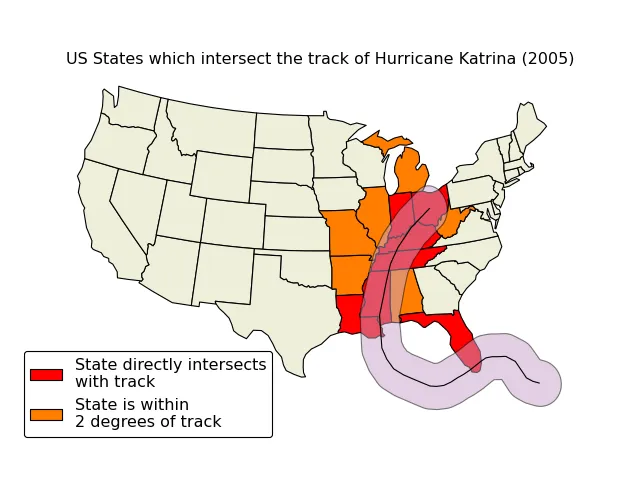 。
。
我尝试了一些坐标放在extend()方法中,但是我没能让它看起来像美国地图一样。或者我需要修改shape文件吗?
图片链接在此
。使用全球行政区域数据集,可在http://www.gadm.org/country下载德国的数据集,并使用cartopy的shapereader(与链接示例中所做的方式相同)。
一个简短的自包含示例:
import cartopy.crs as ccrs
import cartopy.io.shapereader as shpreader
import matplotlib.pyplot as plt

# Downloaded from http://biogeo.ucdavis.edu/data/gadm2/shp/DEU_adm.zip
fname = '/downloads/DEU/DEU_adm1.shp'

adm1_shapes = list(shpreader.Reader(fname).geometries())

ax = plt.axes(projection=ccrs.PlateCarree())

plt.title('Deutschland')
ax.coastlines(resolution='10m')

ax.add_geometries(adm1_shapes, ccrs.PlateCarree(),
                  edgecolor='black', facecolor='gray', alpha=0.5)

ax.set_extent([4, 16, 47, 56], ccrs.PlateCarree())

plt.show()
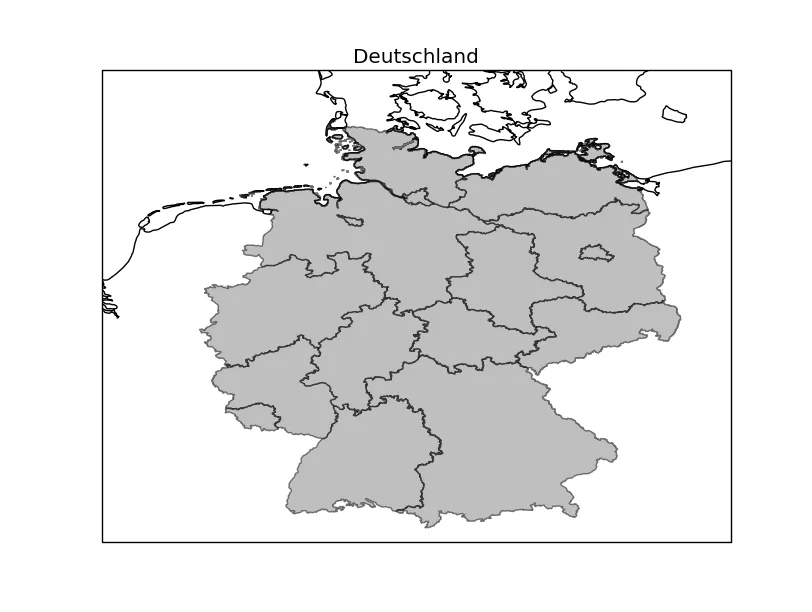
希望这有所帮助。
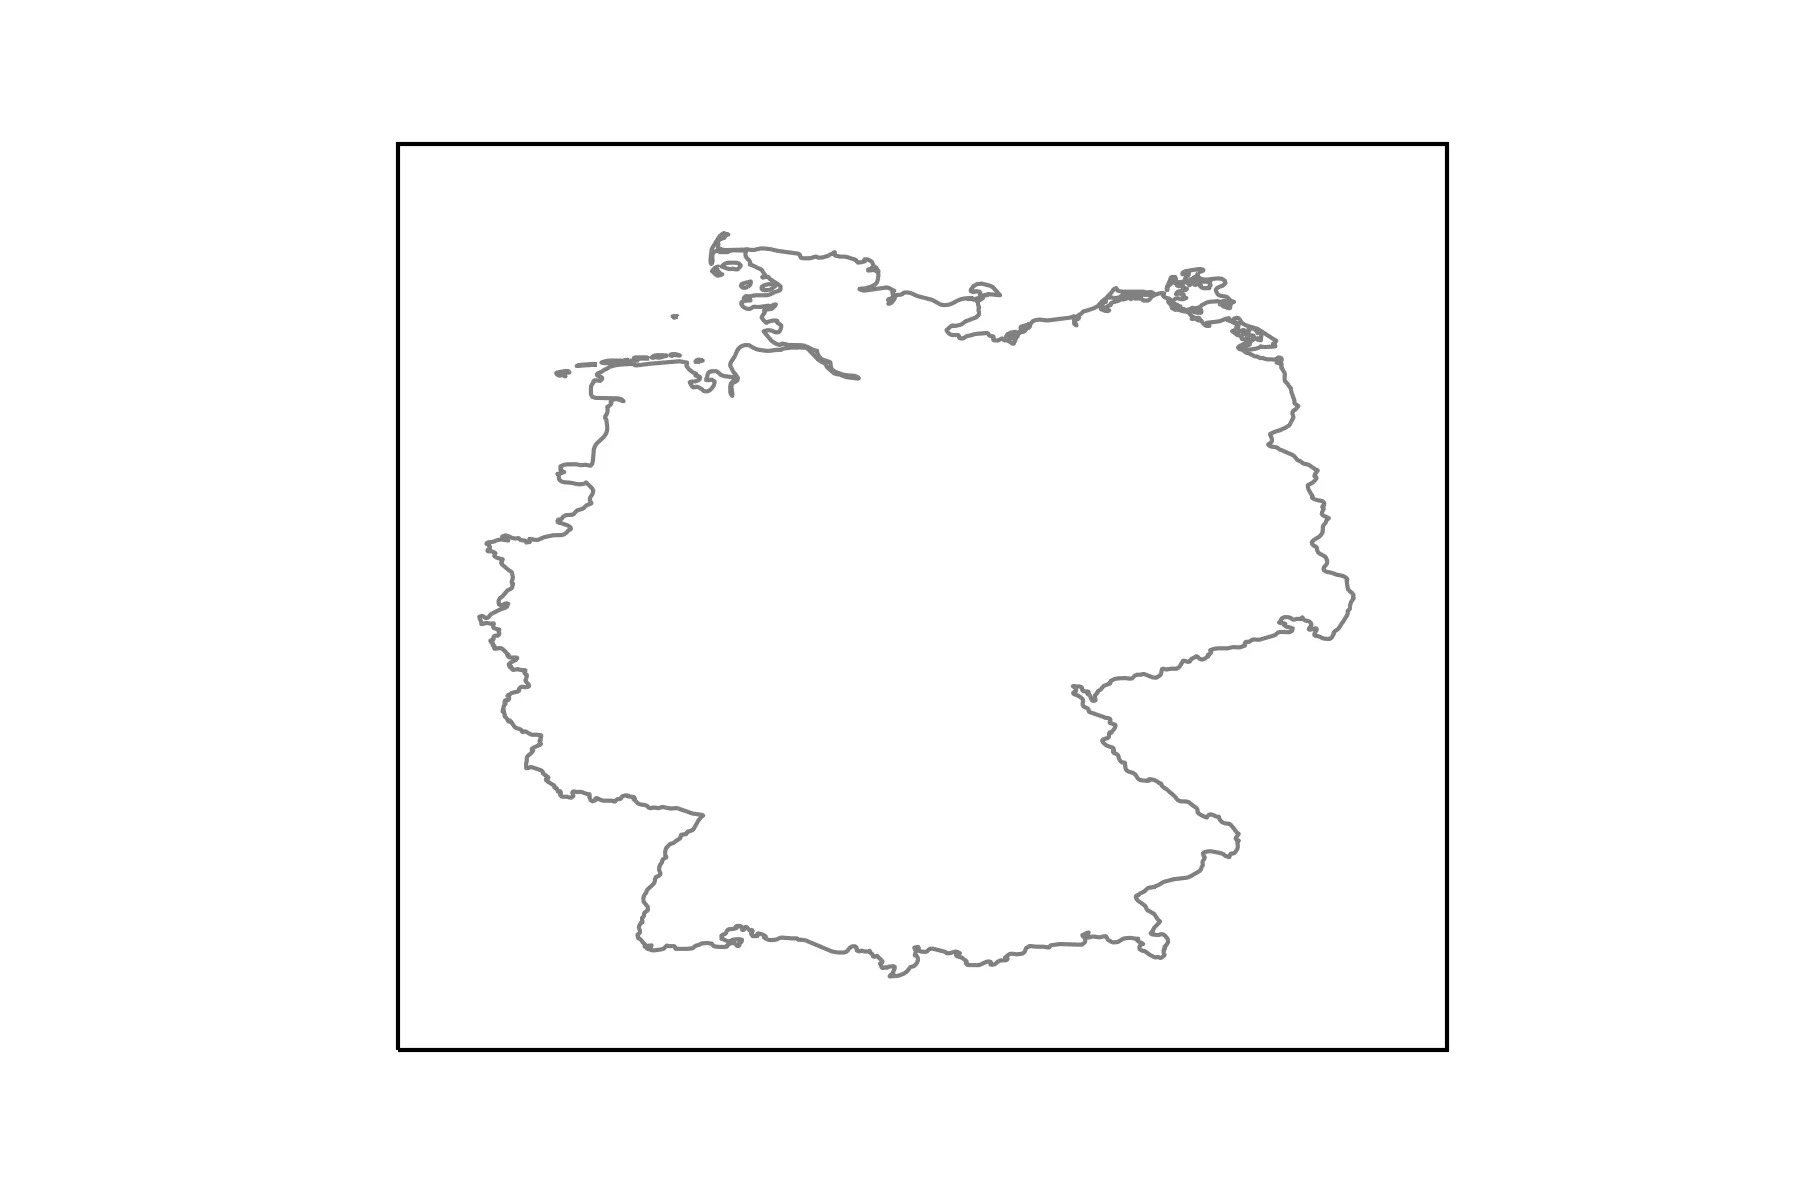
让我举一个例子,使用naturalearthdata的数据。因此,可以将其扩展到任何国家。
from cartopy.io import shapereader
import numpy as np
import geopandas
import matplotlib.pyplot as plt

import cartopy.crs as ccrs

# get natural earth data (http://www.naturalearthdata.com/)

# get country borders
resolution = '10m'
category = 'cultural'
name = 'admin_0_countries'

shpfilename = shapereader.natural_earth(resolution, category, name)

# read the shapefile using geopandas
df = geopandas.read_file(shpfilename)

# read the german borders
poly = df.loc[df['ADMIN'] == 'Germany']['geometry'].values[0]

ax = plt.axes(projection=ccrs.PlateCarree())

ax.add_geometries(poly, crs=ccrs.PlateCarree(), facecolor='none',
                  edgecolor='0.5')

ax.set_extent([5, 16, 46.5, 56], crs=ccrs.PlateCarree())
这导致了以下的图示:
ax.add_geometries(poly, ...)更改为ax.add_geometries([poly]...)。 - JoeZuntz