提高Cartopy地图的分辨率

4
以下代码生成了一个包含每个州等高线的美国地图。问题是这张图片看起来像是用20世纪90年代的技术生成的。如何显著提高图形的质量,即增加背景的分辨率?
import cartopy.crs as ccrs
import cartopy.io.shapereader as shpreader

import pandas as pd
import matplotlib.pyplot as plt
plt.rcParams['figure.dpi'] = 400

fig = plt.figure()
ax = fig.add_axes([0, 0, 1, 1], projection=ccrs.LambertConformal())
ax.set_extent([-125, -66.5, 20, 50], ccrs.Geodetic())
ax.stock_img()


shapename = 'admin_1_states_provinces_lakes_shp'
states_shp = shpreader.natural_earth(resolution='110m', category='cultural',
                                     name=shapename)

ax.outline_patch.set_visible(False)  # don't draw the map border
ax.set_title('My map of the lower 48')

# example state coloring
colors = {
    'Minnesota': [0, 1, 0],
    'Texas': "#FF0000",
    'Montana': "blue",
}
default_color = [0.9375, 0.9375, 0.859375]

for state in shpreader.Reader(states_shp).records():
    facecolor = colors.get(state.attributes['name'], default_color)
    ax.add_geometries([state.geometry], ccrs.PlateCarree(),
                      facecolor=facecolor, edgecolor='black', alpha=0.5,linewidth=0.1)

# example data
df = pd.DataFrame(columns=['city', 'lat', 'lon'], data=[
    ('Hoboken', 40.745255, -74.034775),
    ('Port Hueneme', 34.155834, -119.202789),
    ('Auburn', 42.933334, -76.566666),
    ('Jamestown', 42.095554, -79.238609),
    ('Fulton', 38.846668, -91.948059),
    ('Bedford', 41.392502, -81.534447)
])

ax.plot(df['lon'], df['lat'], transform=ccrs.PlateCarree(),
        ms=8, ls='', marker='*')
#plt.show()
plt.savefig("usa.png")
plt.close()

enter image description here


2
如果您指的是
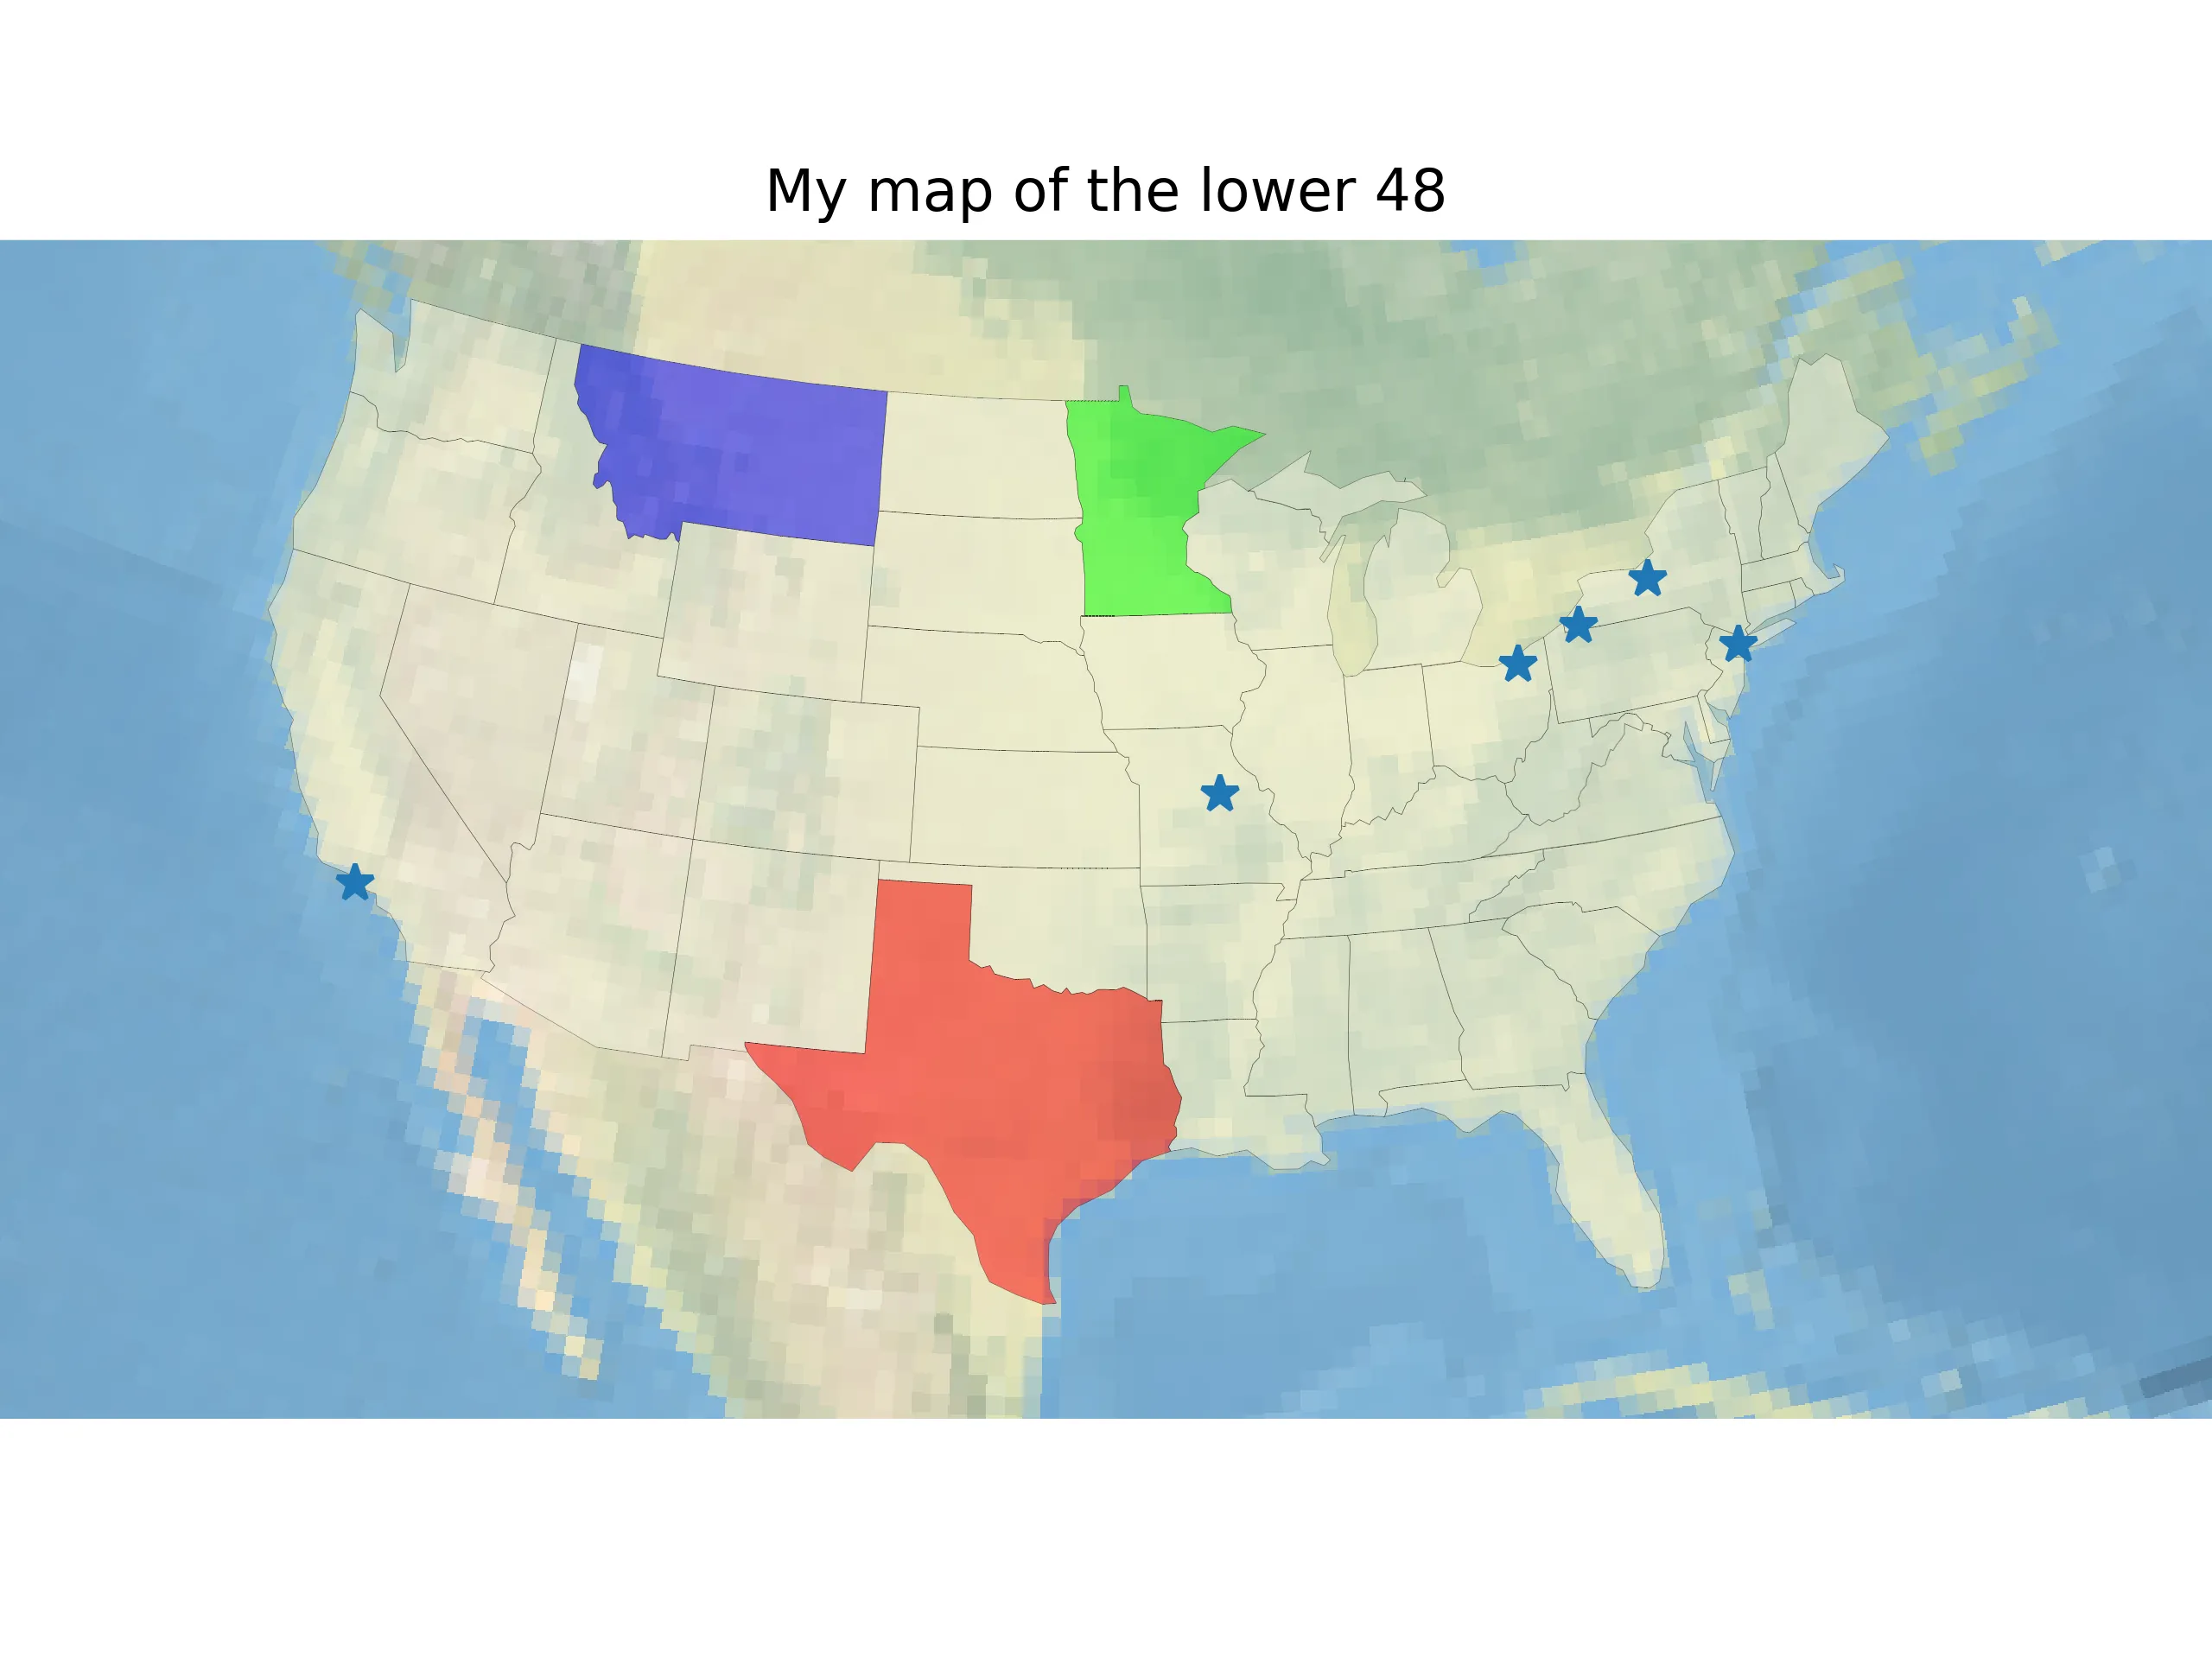
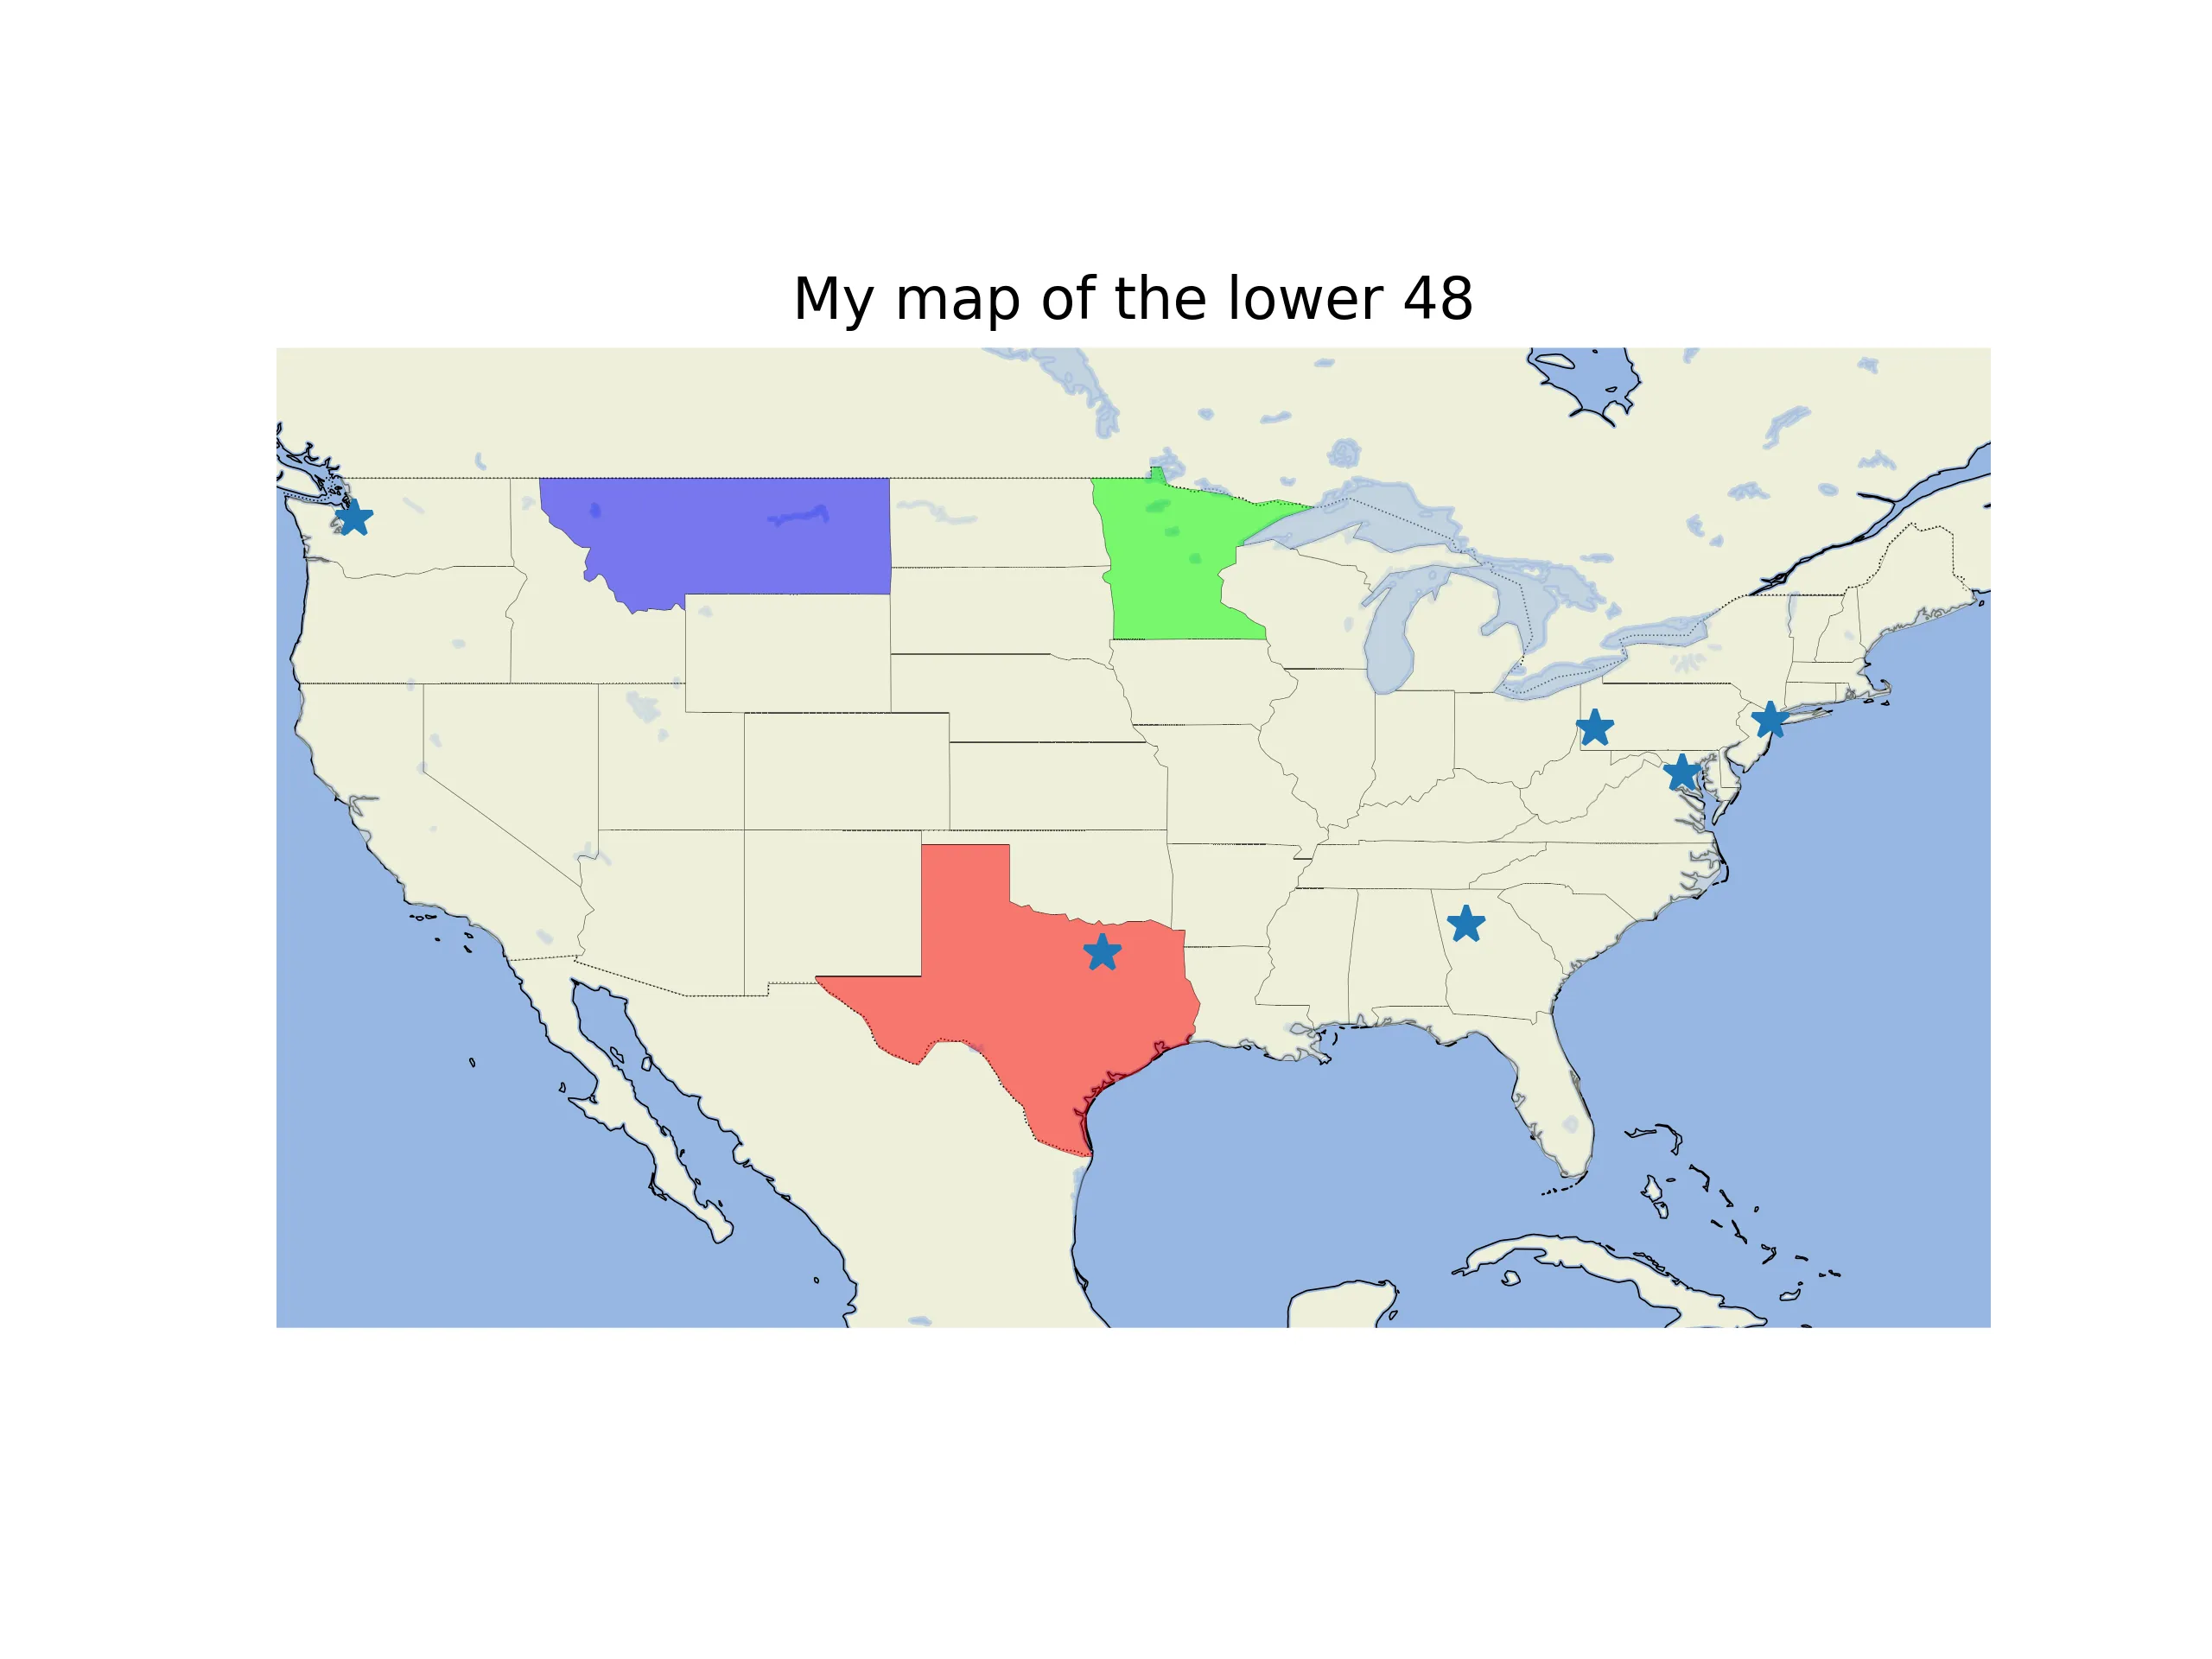
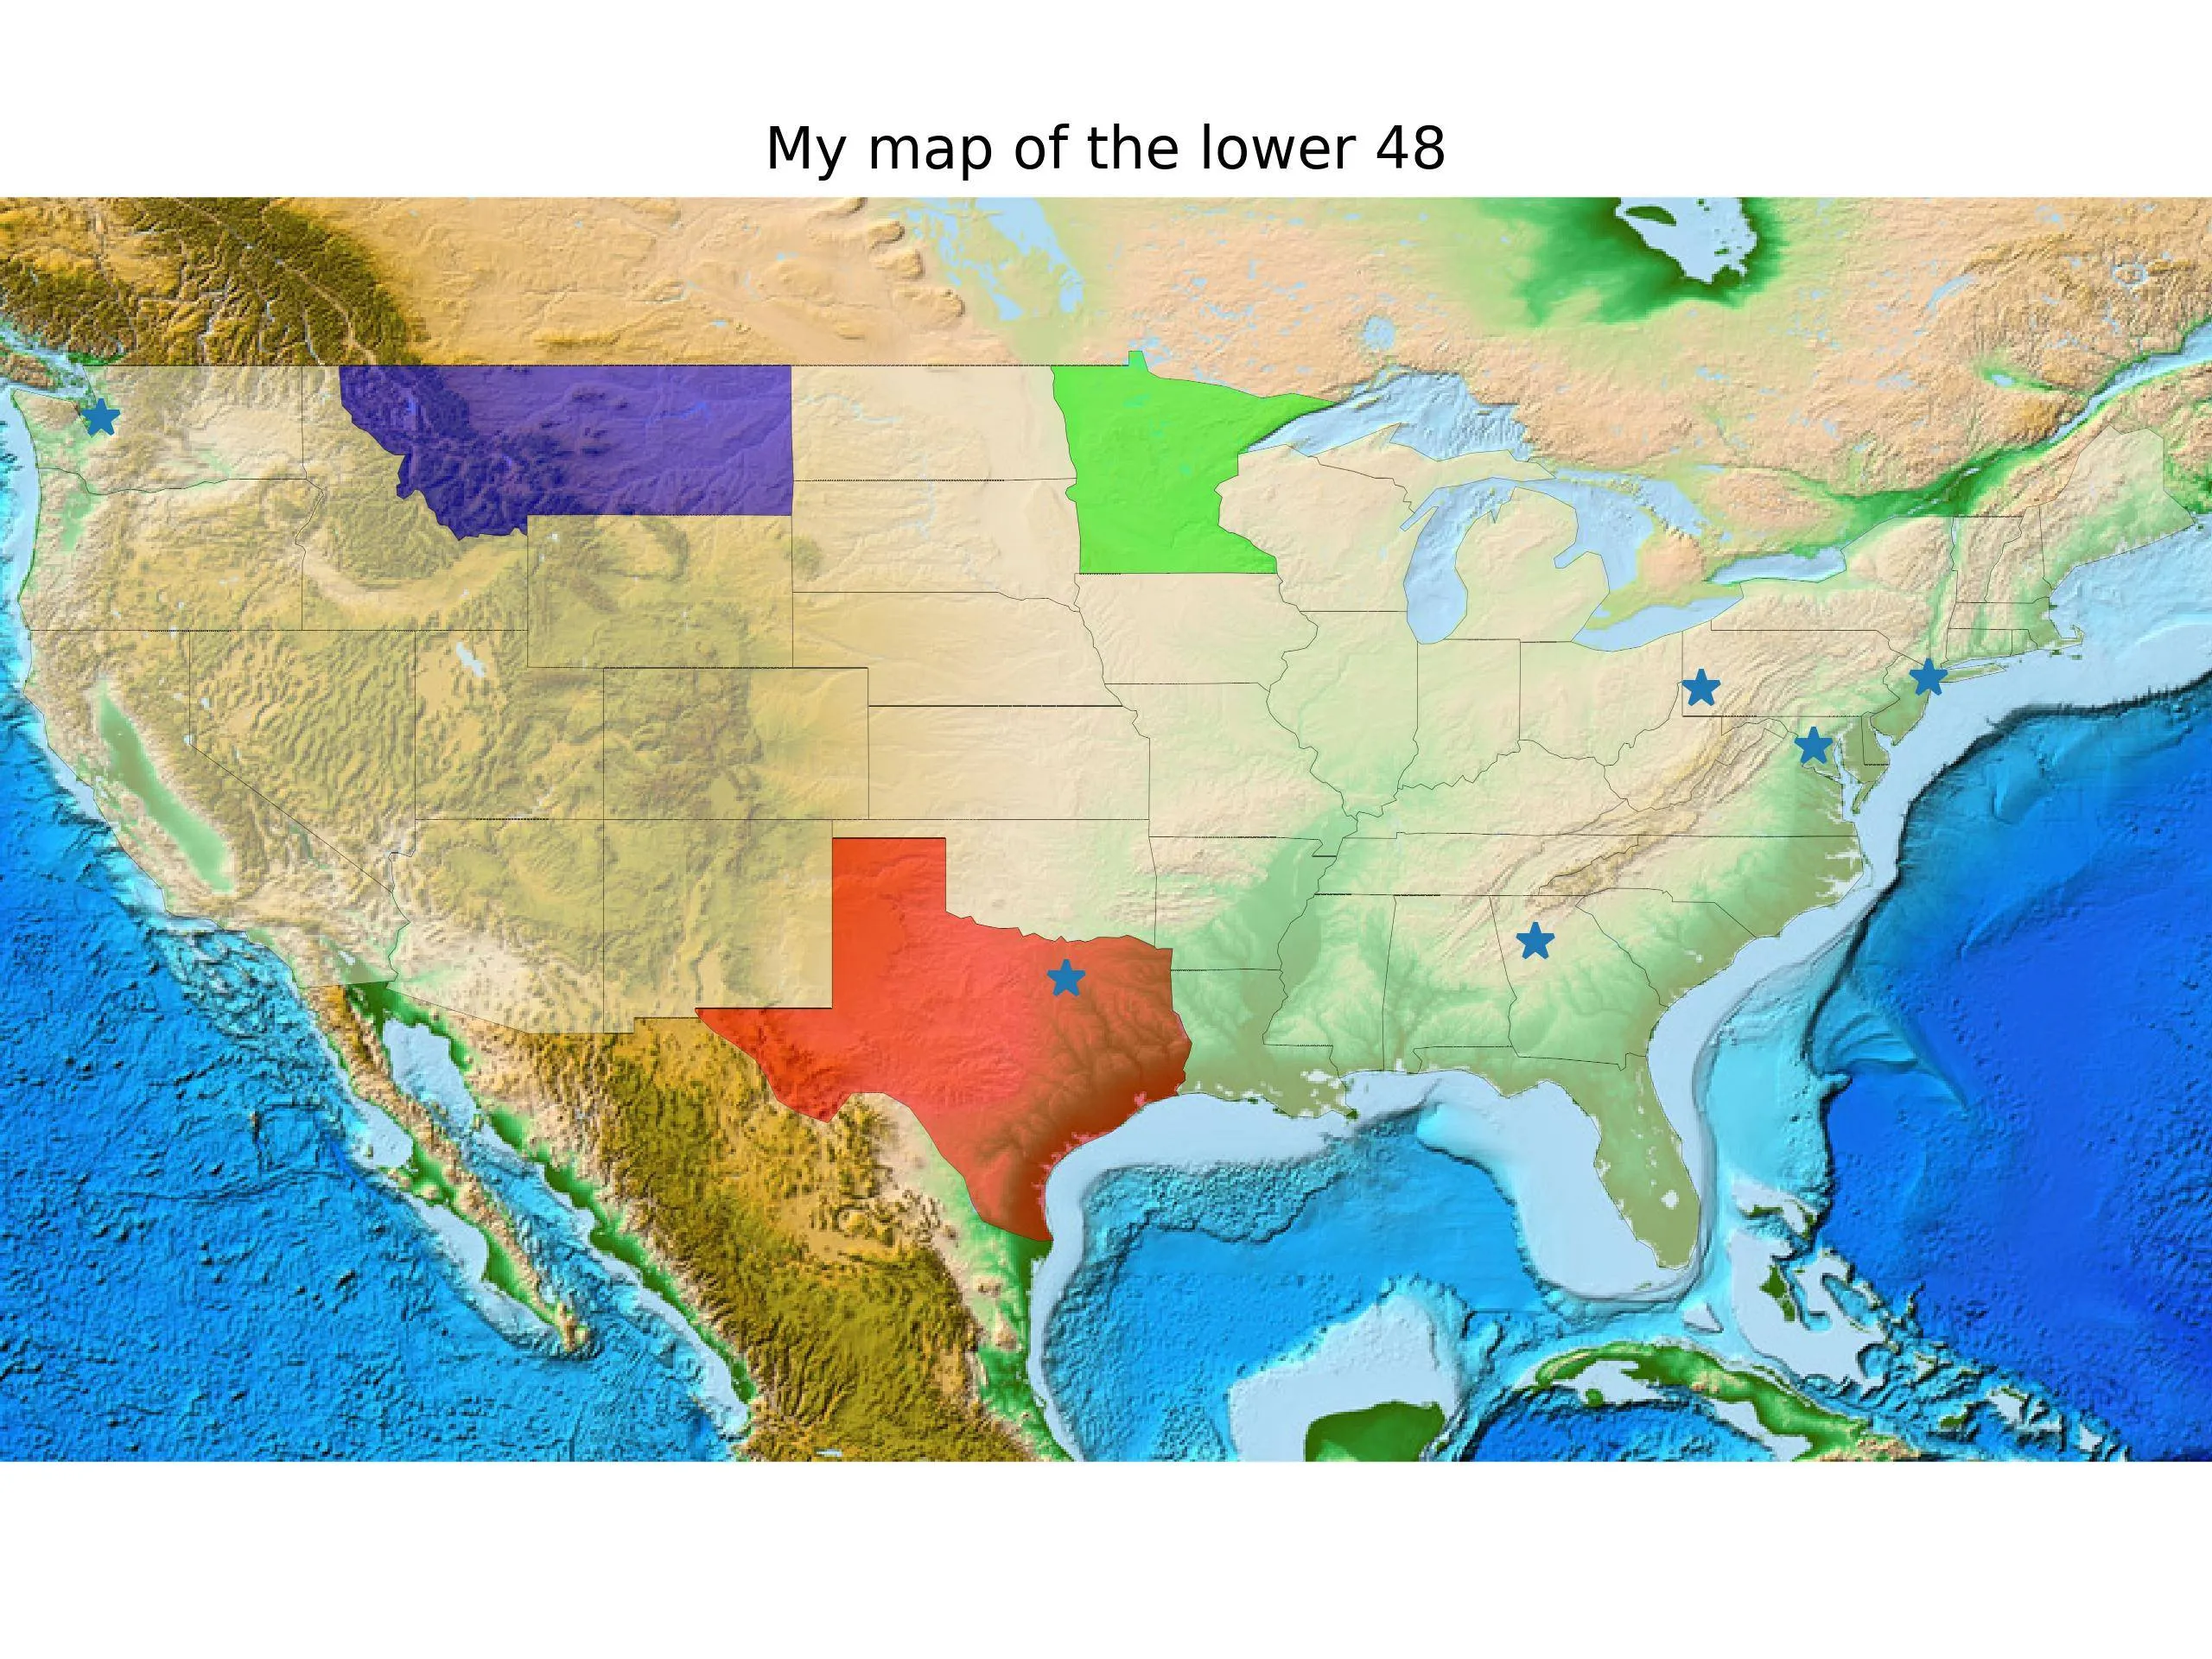
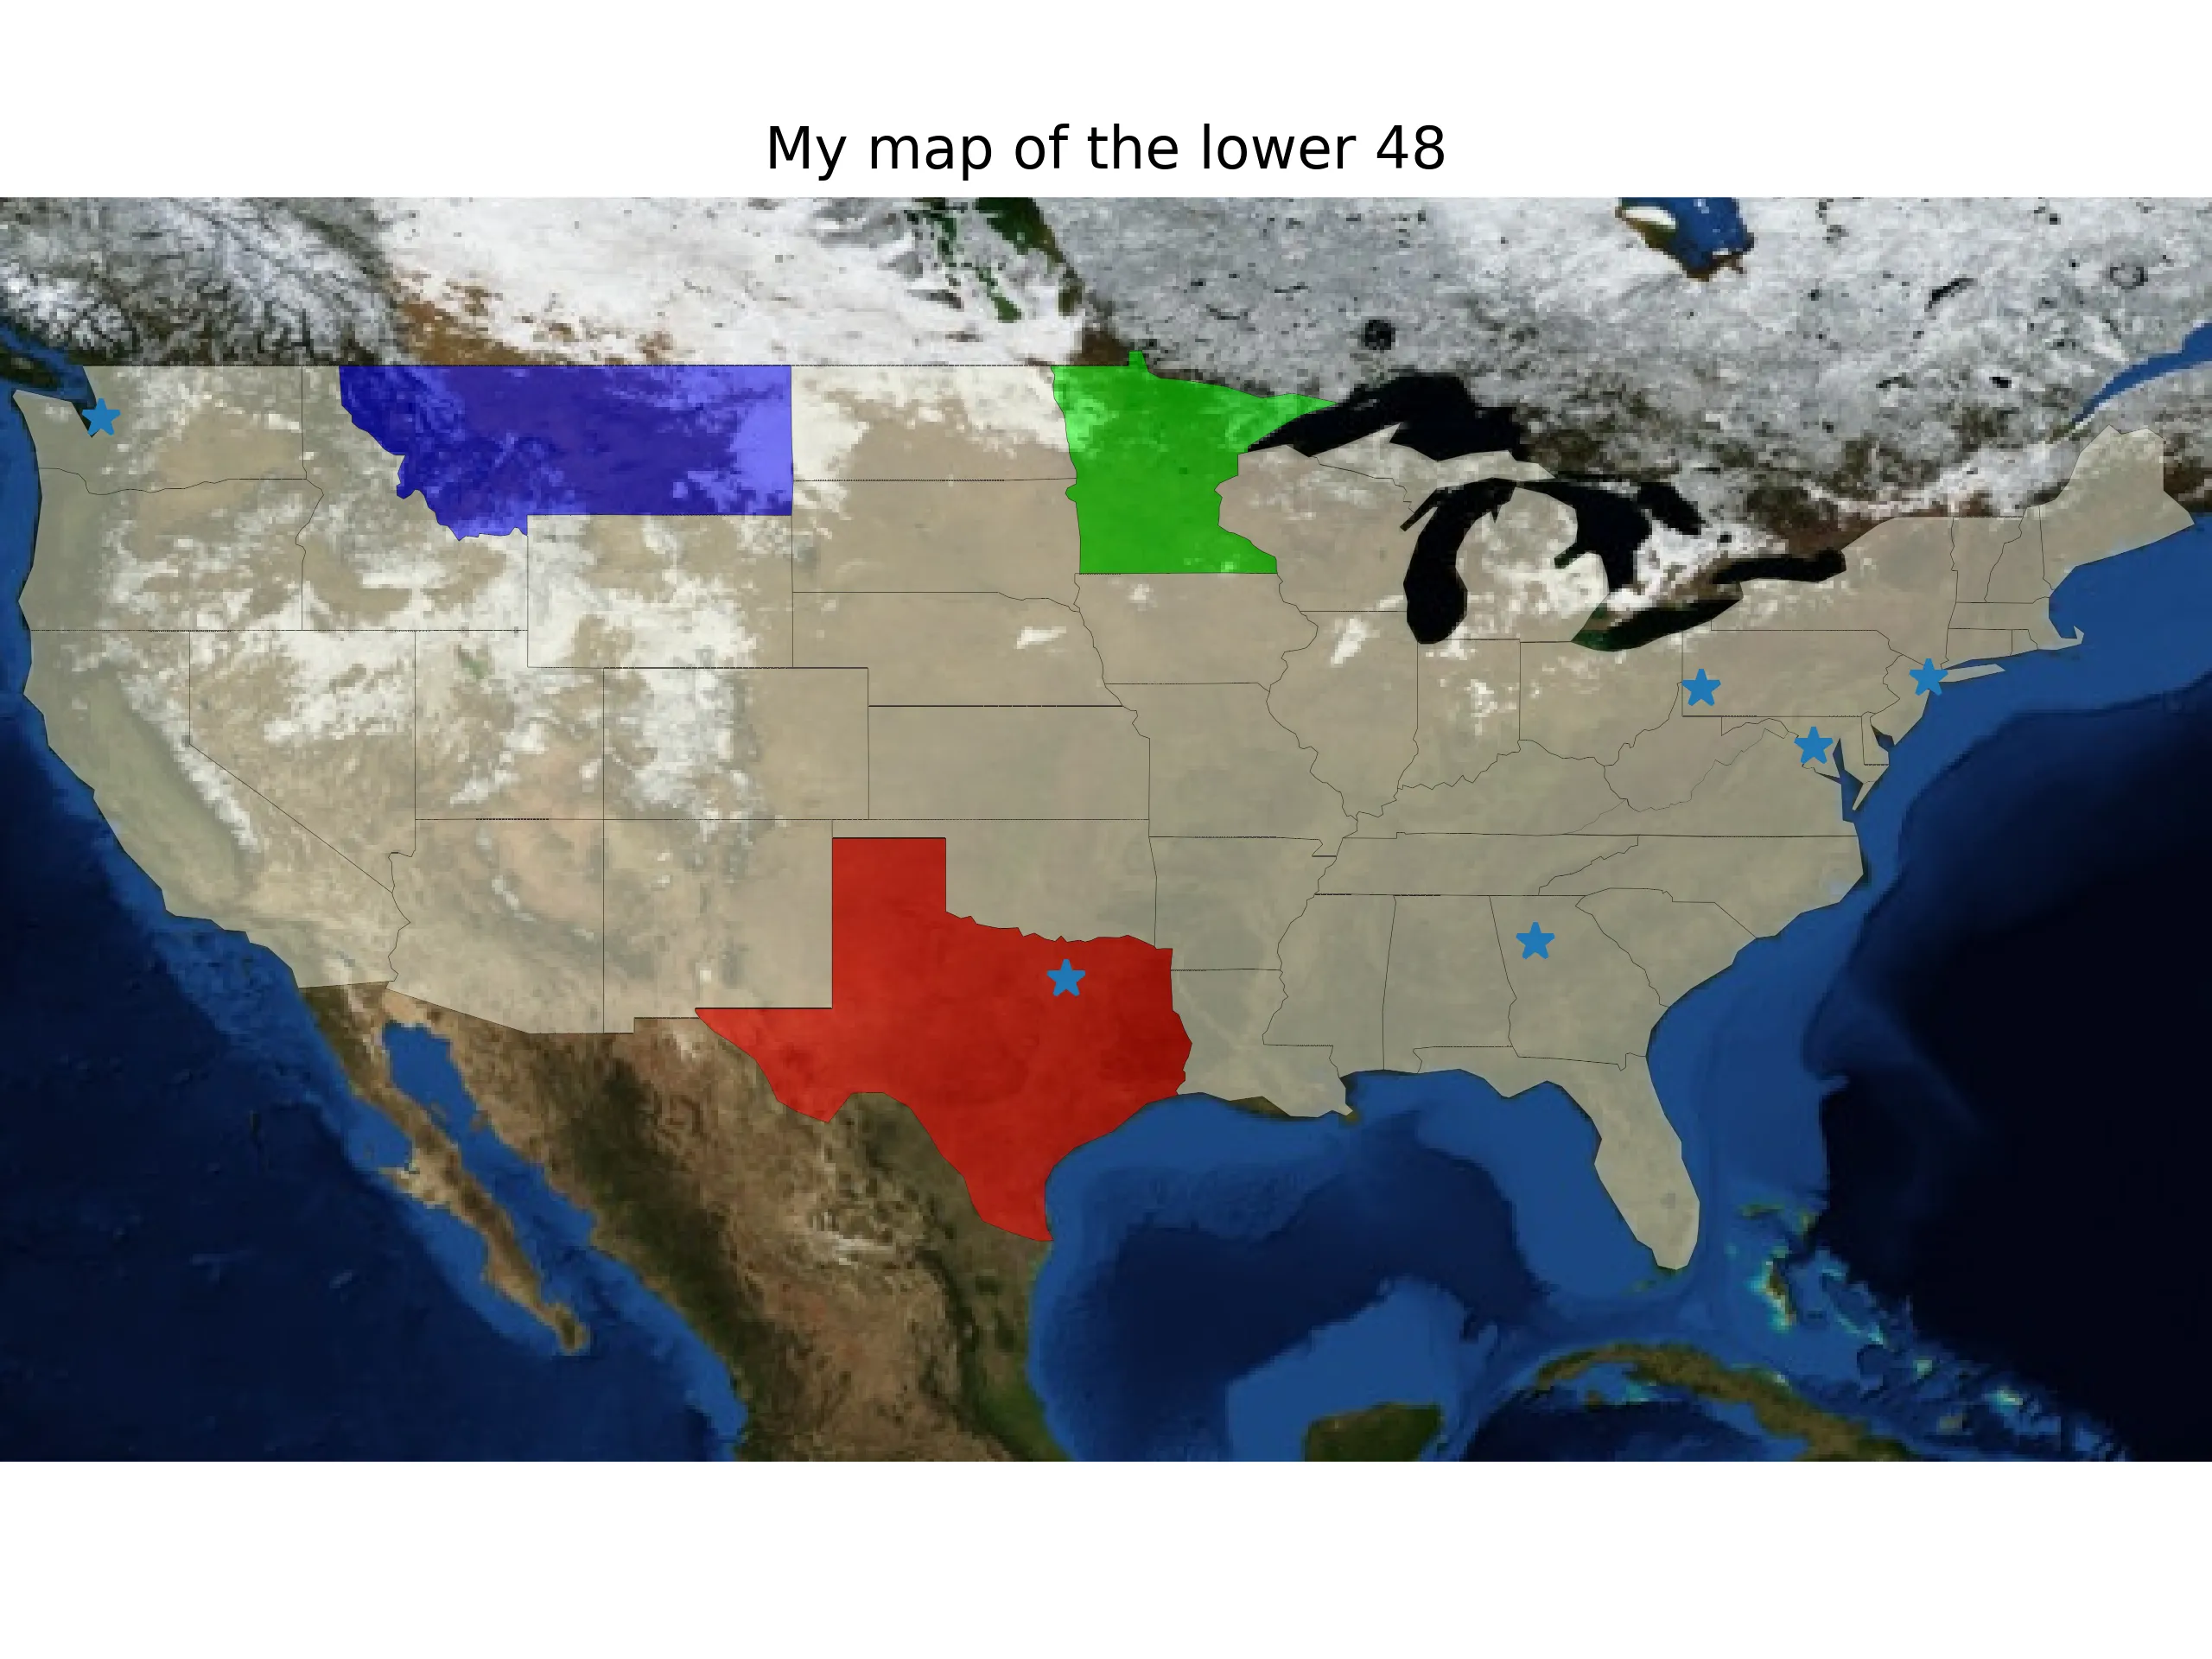
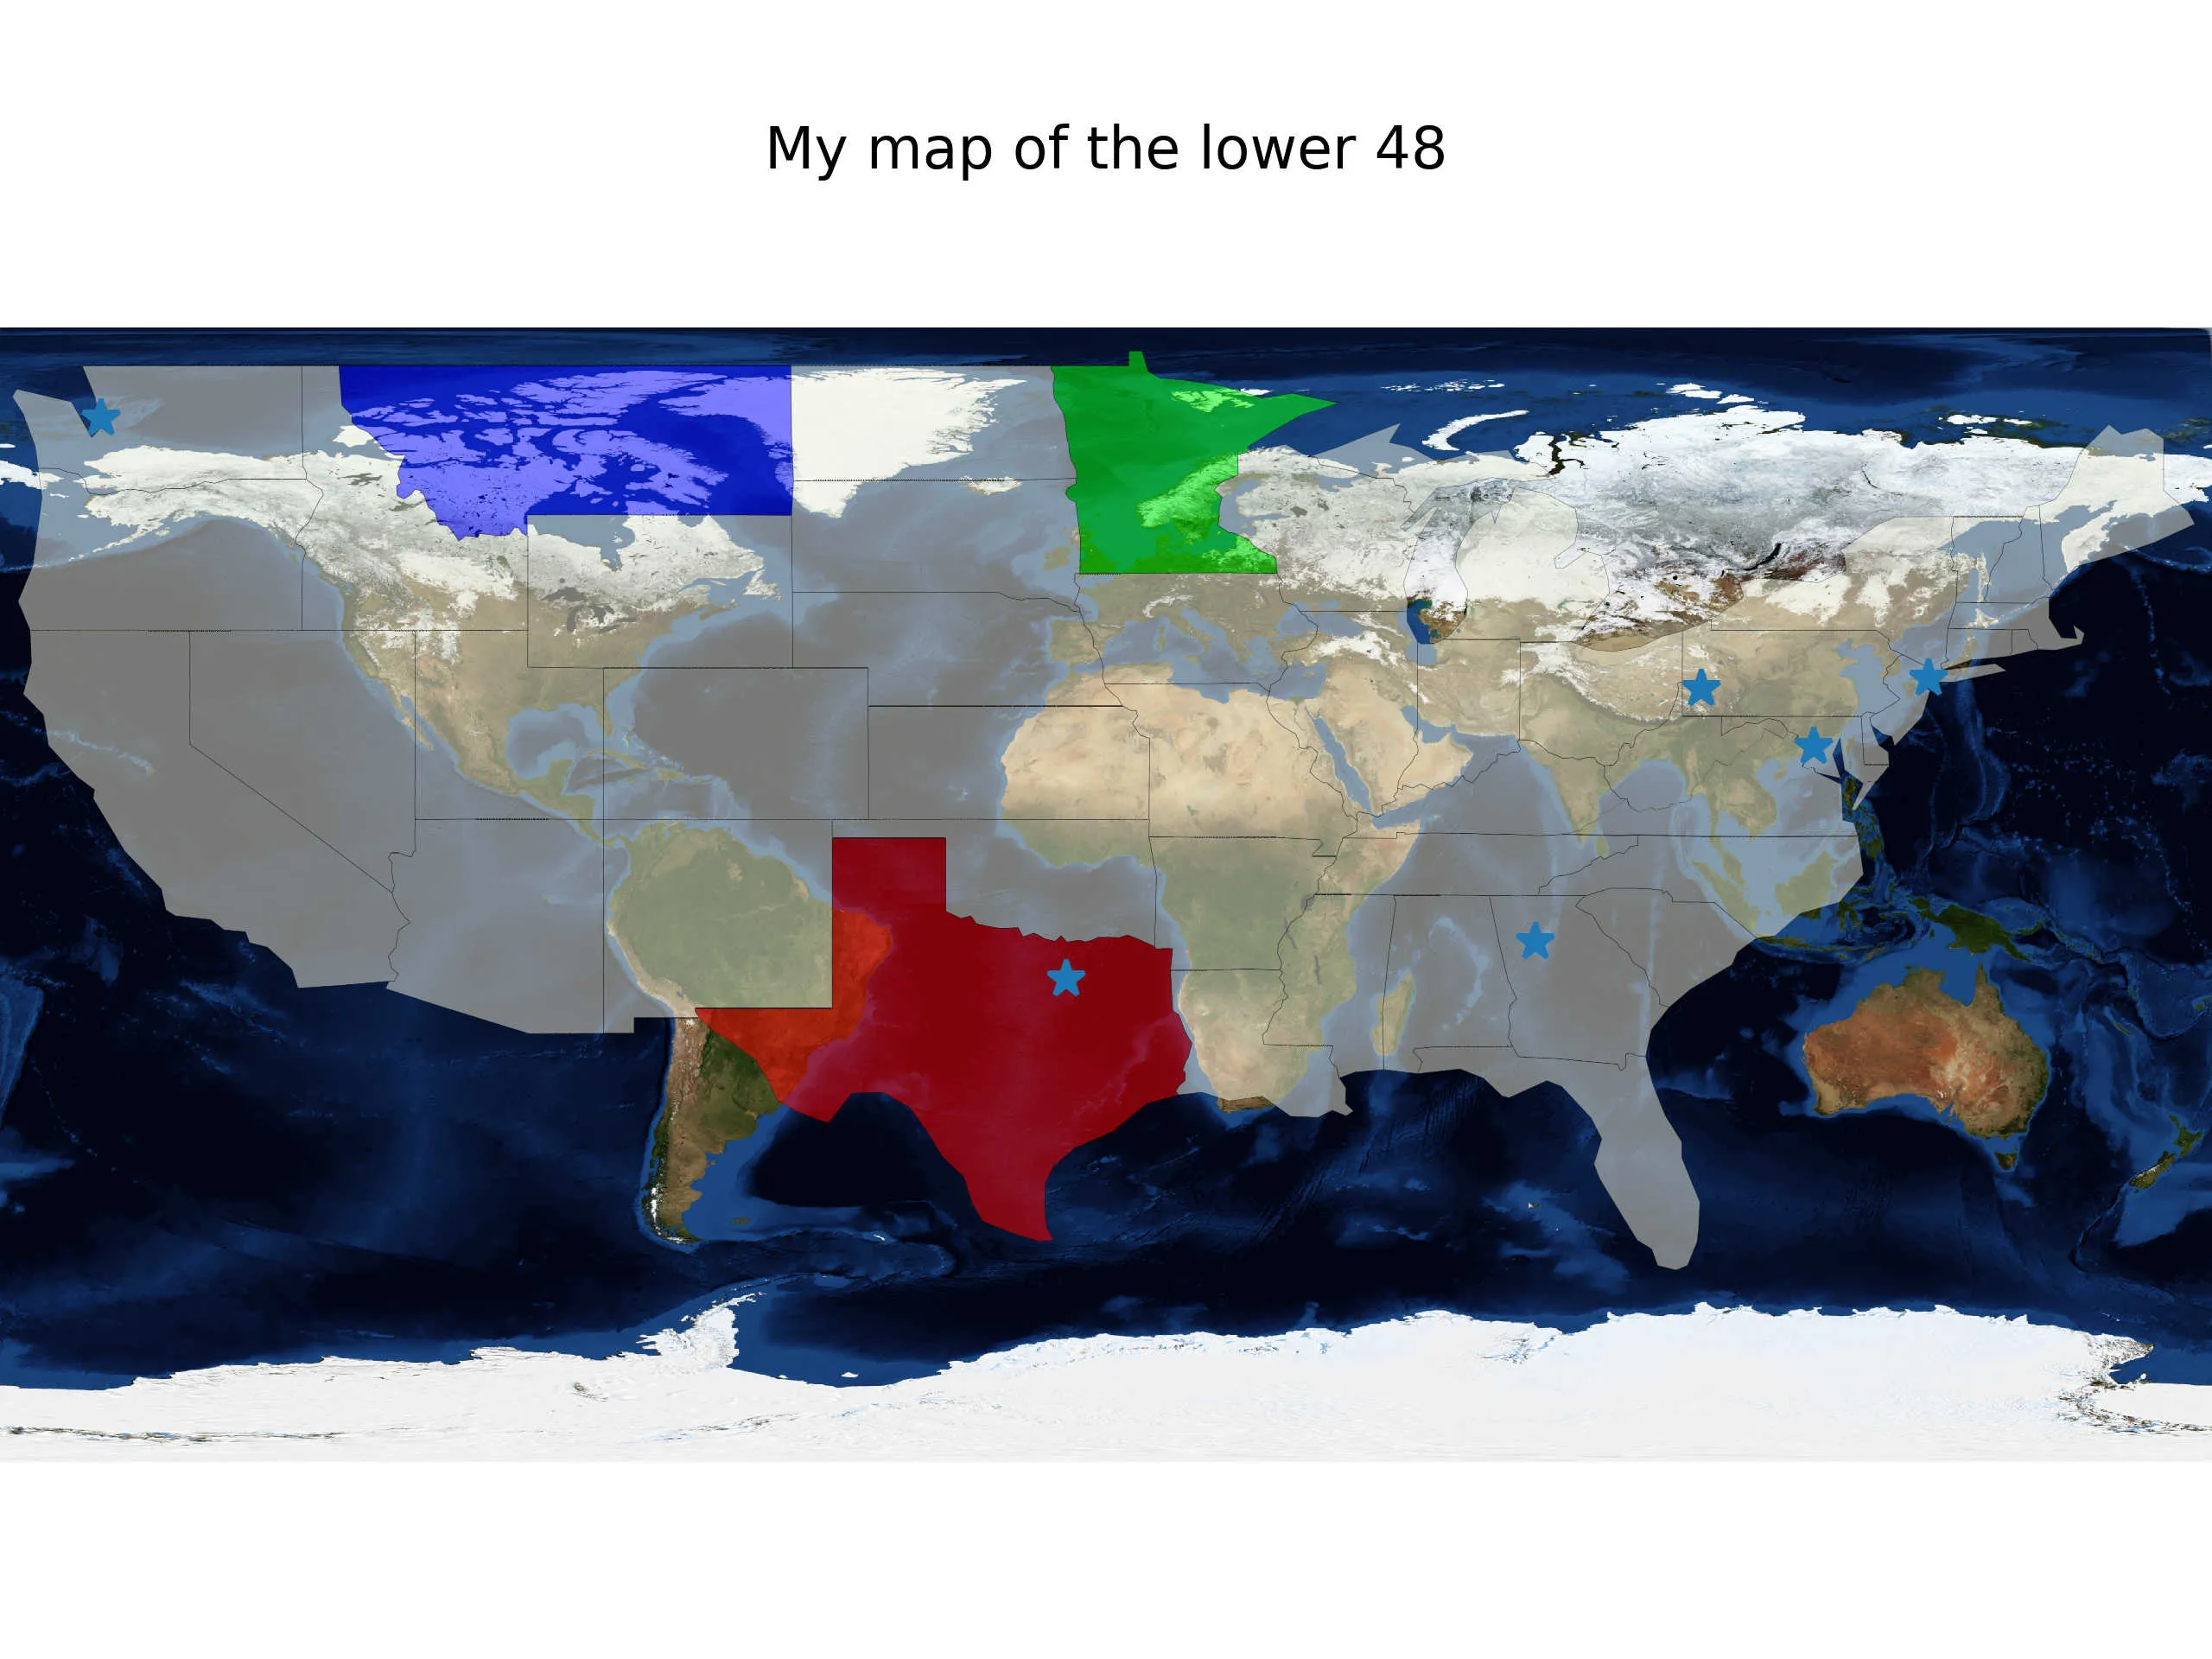
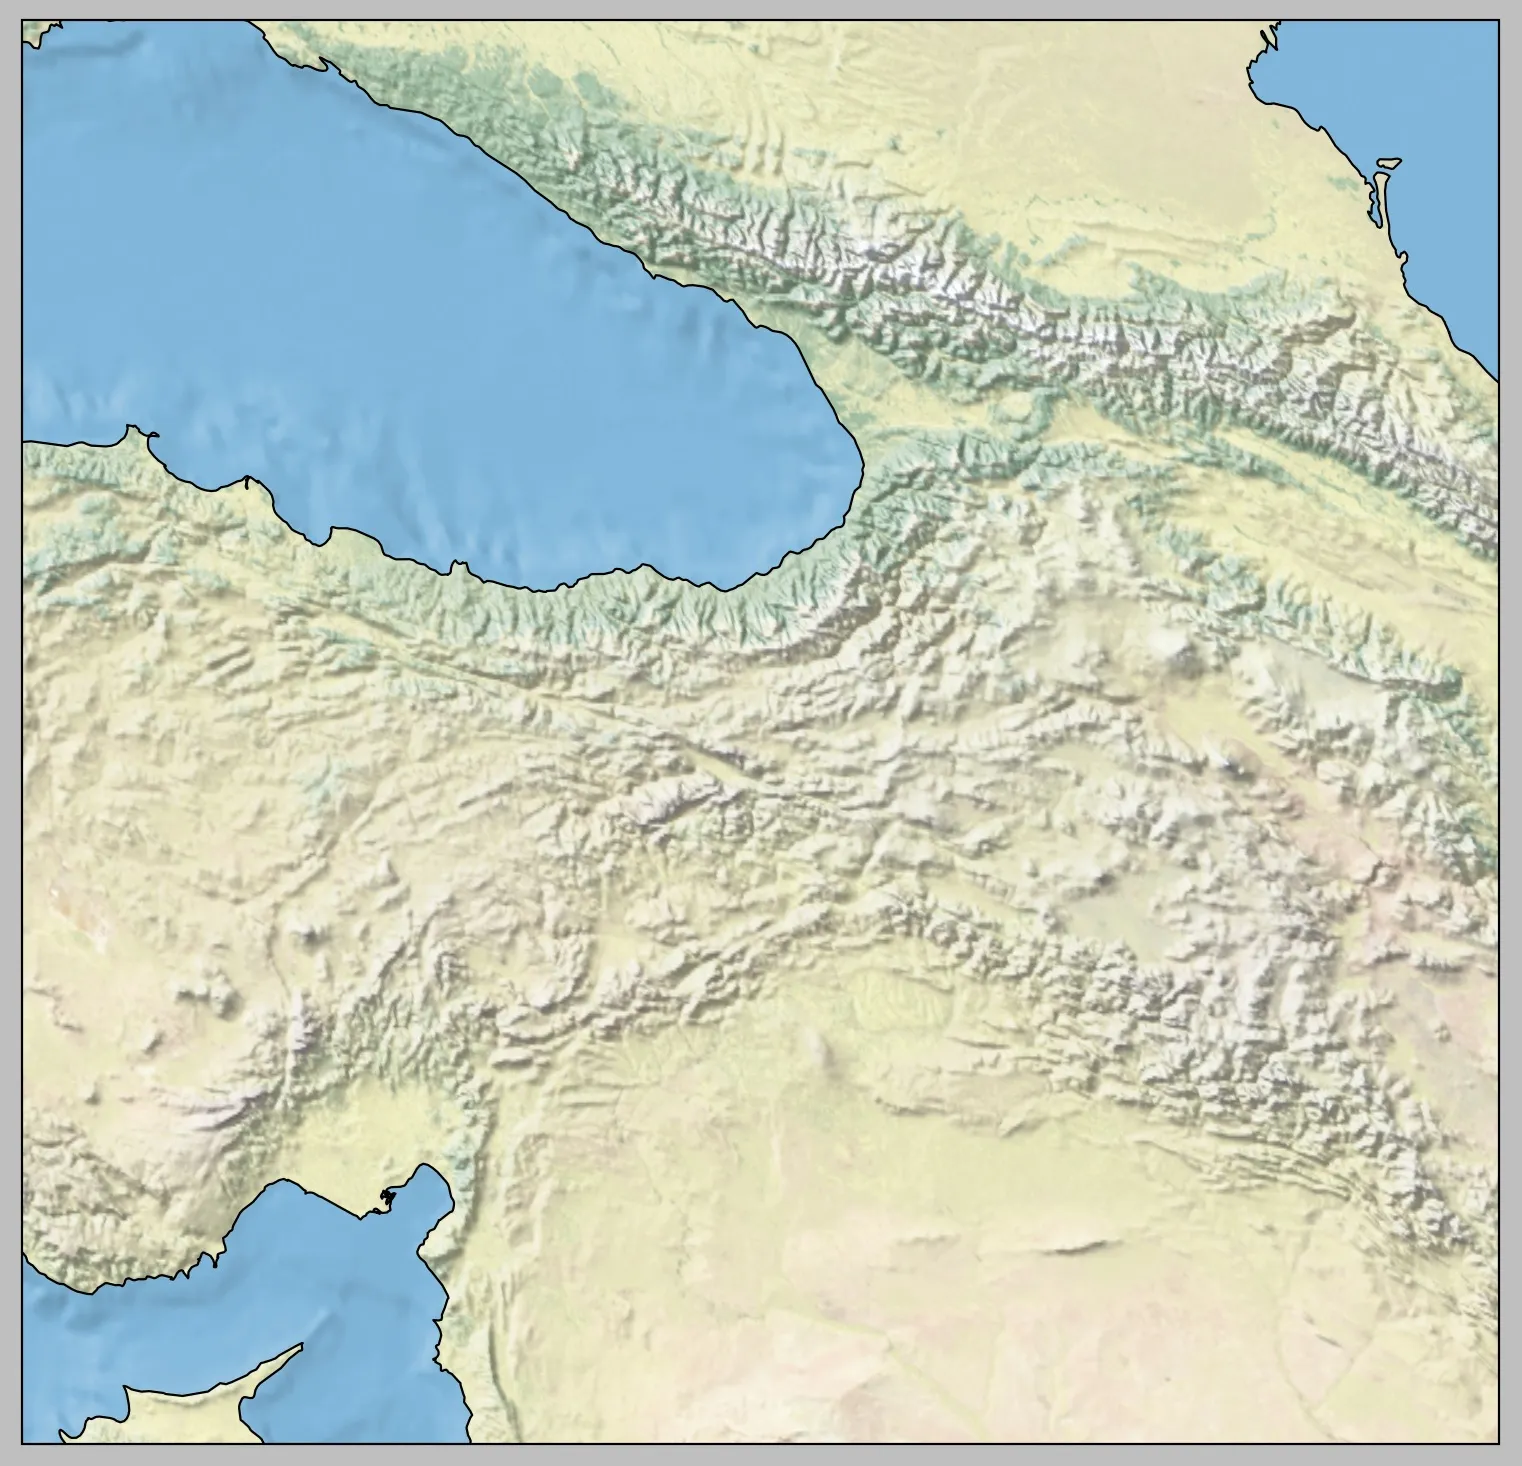
ax.stock_img()的粗糙图像,您可以从互联网上获取更好的图像。例如,NASA蓝色大理石用作底图。 - swatchai
@swatchai 你知道是否存在基础地图的存储库吗?有没有关于使用基础地图的文档,包括哪些图像符合“基础地图”的描述?在阅读了您的评论并能够搜索“cartopy basemap blue marble”并找到一些示例代码之前,我不知道“基础地图”的存在。Cartopy可以从更多的示例中受益。下面是我找到的内容。谢谢! - Joris Kinable
更合适的做法是使用Web地图的瓦片。这里有一个例子:https://dev59.com/dr7pa4cB1Zd3GeqPukHX。 - swatchai
嗨,我发现了NASA的“基础地图”画廊 https://visibleearth.nasa.gov/collection/1484/blue-marble @JorisKinable, - Creeki
2个回答

4
低质量图像是由于库存图像 (ax.stock_img()) 导致的,但我不知道原因为何,这个库存图像非常模糊。我找到了以下解决方案:
(1) 不使用任何背景,但添加一些特征:
fig = plt.figure()
ax = plt.axes(projection=cartopy.crs.PlateCarree())
ax.add_feature(cartopy.feature.LAND)
ax.add_feature(cartopy.feature.OCEAN)
ax.add_feature(cartopy.feature.COASTLINE,linewidth=0.3)
ax.add_feature(cartopy.feature.BORDERS, linestyle=':',linewidth=0.3)
ax.add_feature(cartopy.feature.LAKES, alpha=0.5)
ax.add_feature(cartopy.feature.RIVERS)
ax.set_extent([-125, -66.5, 20, 50])

这个解决方案的另一个示例可以在这里找到。

Simple map using features

(2)使用自定义背景图像。 这种解决方案需要下载一个基础地图背景图像,例如Blue MarbleETOPO Global Relief。 根据这些说明, 下载后,您必须设置全局环境变量:CARTOPY_USER_BACKGROUNDS=path_to_map_folder,该变量指向存储下载地图的文件夹。此外,您还必须创建一个名为images.json的JSON文件并将其存储在同一文件夹中。JSON文件示例内容:

{"__comment__": "JSON file specifying the image to use for a given type/name and resolution. Read in by cartopy.mpl.geoaxes.read_user_background_images.",
  "BM": {
    "__comment__": "Blue Marble Next Generation, July ",
    "__source__": "https://neo.sci.gsfc.nasa.gov/view.php?datasetId=BlueMarbleNG-TB",
    "__projection__": "PlateCarree",
    "low": "bluemarble1degrees.jpeg",
    "high": "bluemarble01degrees.jpeg"},
  "ETOPO": {
    "__comment__": "ETOPO",
    "__source__": "https://www.ngdc.noaa.gov/mgg/global/global.html",
    "__projection__": "PlateCarree",
    "high": "color_etopo1_ice_low.jpg"}
}

最后,可以使用以下代码添加所需的背景:
fig = plt.figure()
ax = fig.add_axes([0, 0, 1, 1], projection=ccrs.PlateCarree())
ax.set_extent([-125, -66.5, 20, 50], ccrs.Geodetic())
ax.background_img(name='ETOPO', resolution='high')

上面的代码将使用ETOPO背景。要使用Blue Marble背景,请将最后一行更改为:ax.background_img(name='BM', resolution='high')。请注意,名称和分辨率参数必须与JSON文件中的条目匹配。
ETOPO: Etopo map 蓝色大理石: Blue marble map 最后,根据这个 Kaggle帖子,也可以直接将基础地图加载为图像背景。这将更加方便,因为它跳过了设置环境变量和编写JSON文件的步骤。
fig = plt.figure()
ax = fig.add_axes([0, 0, 1, 1], projection=ccrs.PlateCarree())
ax.set_extent([-125, -66.5, 20, 50], ccrs.Geodetic())
img = plt.imread('./bluemarble01degrees.jpeg')
img_extent = (-125, -66.5, 20, 50)
ax.imshow(img, origin='upper', extent=img_extent, transform=ccrs.PlateCarree())

很遗憾,我无法让上述解决方案起作用,因为它没有对地图的相关部分进行缩放:

enter image description here


请尝试使用 projection=ccrs.LambertConformal() - swatchai
我按照第二点操作,它可以正常工作,但是在定义全局变量时,你必须以这种方式编写:os.environ["CARTOPY_USER_BACKGROUNDS"] = dir_path - Alberto Ursino

0
我刚刚在这里回答了一个非常类似的问题-这也可能对这篇文章有兴趣。通过这个解决方案,可以将高分辨率的自然地球背景图像添加到任何Cartopy地图投影中。我使用pyinterp对图像进行空间插值,而不是使用imshow,因为后者对于高分辨率数据来说非常慢。这是一个(放大的)示例: enter image description here

网页内容由stack overflow 提供, 点击上面的
可以查看英文原文,
原文链接