Python cartopy地图,裁剪国家(多边形)外的区域

7
我用NaturalEarth创建了一个带有国界的Stamen地形图。现在我想从国界之外删除所有数据(在这种情况下是地形)。我该怎么做?
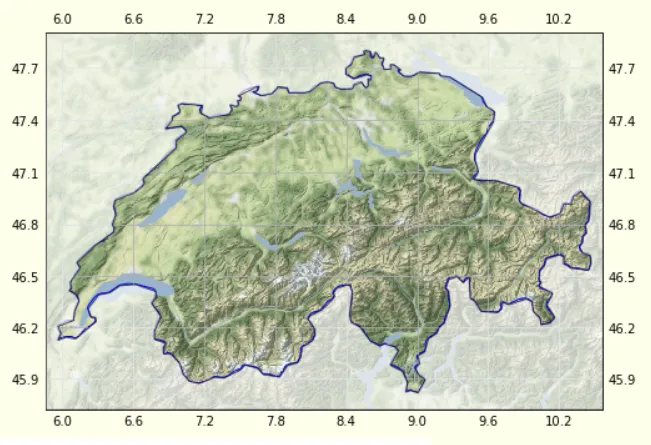
以下是我的示例,瑞士内外可见地形:
from cartopy.io import shapereader
import cartopy.io.img_tiles as cimgt
import cartopy.crs as ccrs
import geopandas
import matplotlib.pyplot as plt


resolution = '10m'
category = 'cultural'
name = 'admin_0_countries'

shpfilename = shapereader.natural_earth(resolution, category, name)

df = geopandas.read_file(shpfilename)

poly = [df.loc[df['ADMIN'] == 'Switzerland']['geometry'].values[0]]

stamen_terrain = cimgt.Stamen('terrain-background')

fig = plt.figure(figsize=(8,6))

ax = fig.add_subplot(1, 1, 1, projection=stamen_terrain.crs)
ax.add_geometries(poly, crs=ccrs.PlateCarree(), facecolor='none', edgecolor='r')
exts = [poly[0].bounds[0], poly[0].bounds[2], poly[0].bounds[1], poly[0].bounds[3]]
ax.set_extent(exts, crs=ccrs.Geodetic())

ax.add_image(stamen_terrain, 8)
fig.tight_layout()
plt.show()

这里输入图片描述

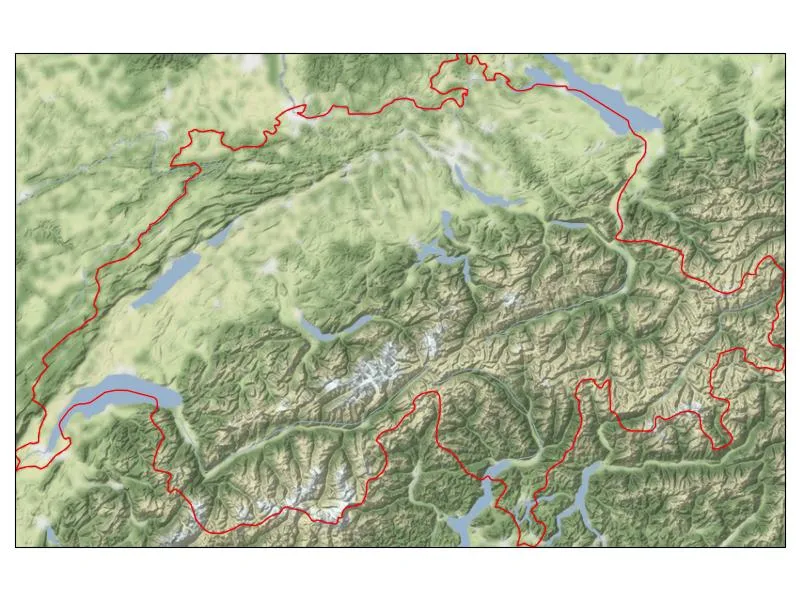
如何只显示边界内的地形,其余区域呈白色/透明?

尝试过以下方法,但目前没有成功: https://scitools.org.uk/cartopy/docs/latest/gallery/logo.html

1个回答

8
你需要一个遮罩来隐藏图像中不想要的部分。这里有一个可运行的代码,演示了获取预期图形的所有步骤。
from shapely.geometry import Polygon
from cartopy.io import shapereader
import cartopy.io.img_tiles as cimgt
import cartopy.crs as ccrs
import geopandas
import matplotlib.pyplot as plt

def rect_from_bound(xmin, xmax, ymin, ymax):
    """Returns list of (x,y)'s for a rectangle"""
    xs = [xmax, xmin, xmin, xmax, xmax]
    ys = [ymax, ymax, ymin, ymin, ymax]
    return [(x, y) for x, y in zip(xs, ys)]

# request data for use by geopandas
resolution = '10m'
category = 'cultural'
name = 'admin_0_countries'

shpfilename = shapereader.natural_earth(resolution, category, name)
df = geopandas.read_file(shpfilename)

# get geometry of a country
poly = [df.loc[df['ADMIN'] == 'Switzerland']['geometry'].values[0]]

stamen_terrain = cimgt.Stamen('terrain-background')

# projections that involved
st_proj = stamen_terrain.crs  #projection used by Stamen images
ll_proj = ccrs.PlateCarree()  #CRS for raw long/lat

# create fig and axes using intended projection
fig = plt.figure(figsize=(8,6))
ax = fig.add_subplot(1, 1, 1, projection=st_proj)
ax.add_geometries(poly, crs=ll_proj, facecolor='none', edgecolor='black')

pad1 = .1  #padding, degrees unit
exts = [poly[0].bounds[0] - pad1, poly[0].bounds[2] + pad1, poly[0].bounds[1] - pad1, poly[0].bounds[3] + pad1];
ax.set_extent(exts, crs=ll_proj)

# make a mask polygon by polygon's difference operation
# base polygon is a rectangle, another polygon is simplified switzerland
msk = Polygon(rect_from_bound(*exts)).difference( poly[0].simplify(0.01) )
msk_stm  = st_proj.project_geometry (msk, ll_proj)  # project geometry to the projection used by stamen

# get and plot Stamen images
ax.add_image(stamen_terrain, 8) # this requests image, and plot

# plot the mask using semi-transparency (alpha=0.65) on the masked-out portion
ax.add_geometries( msk_stm, st_proj, zorder=12, facecolor='white', edgecolor='none', alpha=0.65)

ax.gridlines(draw_labels=True)

plt.show()

生成的图表:

输入图片说明

以及蒙版:

输入图片说明

编辑1

上述代码适用于单个国家。如果多个相邻的国家是我们的新目标,则需要选择它们所有并将其溶解为单个几何图形。只需要修改几行代码。

示例:新的目标国家:['挪威','瑞典','芬兰']

要替换的代码行:

poly = [df.loc[df['ADMIN'] == 'Switzerland']['geometry'].values[0]]

需要替换的新代码:

scan3 = df[ df['ADMIN'].isin(['Norway','Sweden', 'Finland']) ]
scan3_dissolved = scan3.dissolve(by='LEVEL')
poly = [scan3_dissolved['geometry'].values[0]]

样本输出地图: enter image description here

1
谢谢,我也感谢您,这正是我在寻找的! - Exi

网页内容由stack overflow 提供, 点击上面的
可以查看英文原文,
原文链接