如何在我的图表中打破y轴不从0开始?我猜用ggplot无法实现。还有其他解决方案吗?
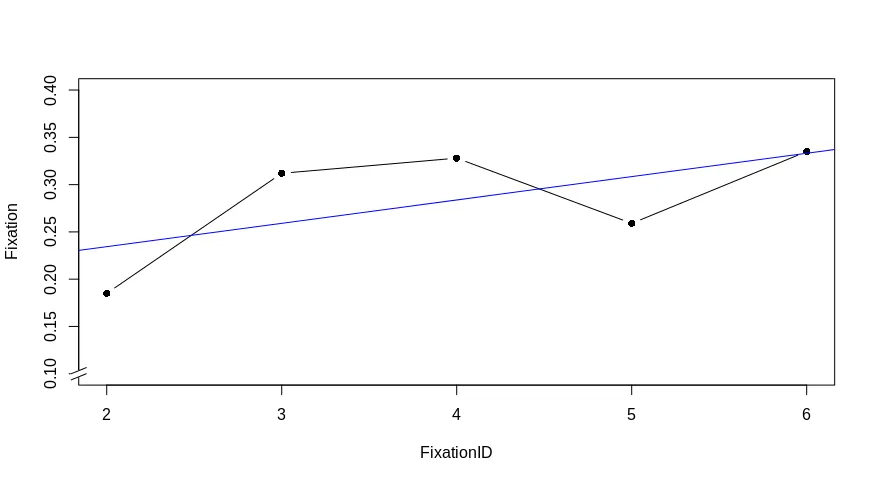
我想要这个效果: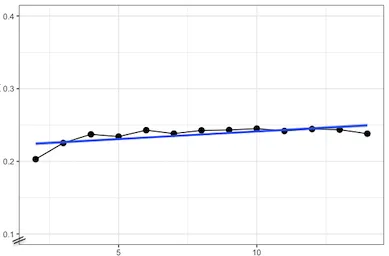
我的ggplot:
ggplot(allEvents %>% dplyr::filter(FixationID>1,FixationID<15), aes(FixationID, Fixation)) +
  geom_line(stat="summary", fun.y=mean, position="identity") + theme_bw() + stat_summary(fun.data=mean_se)+
  labs (x = "Ordinal fixation number", y = "Fixation duration (s)") +
  scale_y_continuous (name="Fixation duration (s) ", limits=c(0.1, 0.4)) +
  scale_x_continuous (name="Ordinal fixation number", breaks=c(5,10,15,20)) +
  geom_smooth(method=lm)
我的数据摘要:
structure(list(Fixation = c(0.383, 0.185, NA, 0.312, NA, 0.328,
NA, 0.259, NA, 0.335), FixationID = c(1, 2, NA, 3, NA, 4, NA,
5, NA, 6)), .Names = c("Fixation", "FixationID"), row.names = c(NA,
10L), class = "data.frame")