我想在facet_wraps的上方行中显示绘图的x轴刻度。例如:

library(ggplot2)
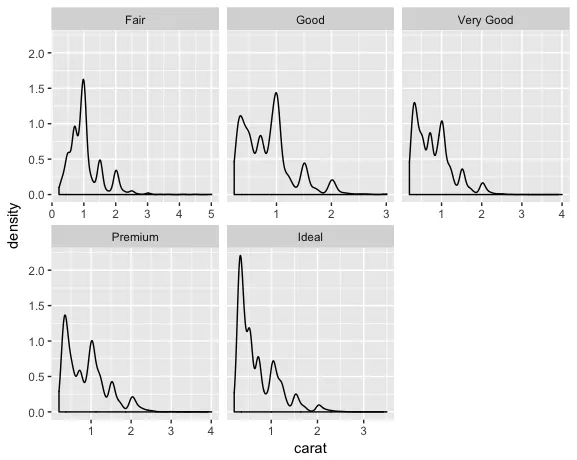
ggplot(diamonds, aes(carat)) + facet_wrap(~ cut, scales = "fixed") + geom_density()
生成这个图:
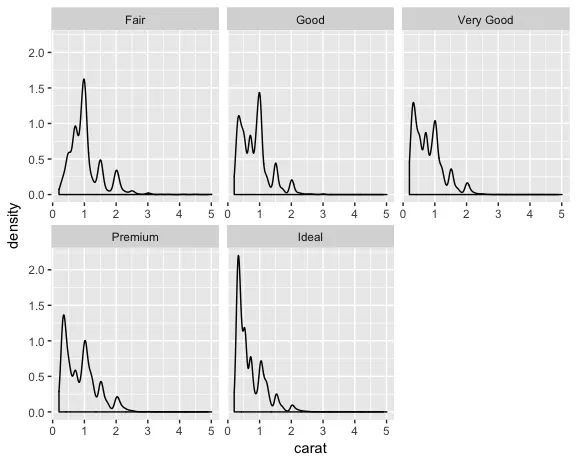
我想在这个图上添加如下所示的刻度线:
有没有一种简单的方法可以实现这个结果?