我正在绘制一些数据,并希望在我的图表的x轴上标记刻度。我的数据长这样:
  publication   labels   percentage
1 foo           0       .4572
2 foo           1       .0341
3 foo           2       .09478
4 foo           3       .0135
5 bar           0       .7442
6 bar           1       .2847
每个名称都有从0到9的标签。
我的代码如下:
ggplot(aes(y = percentage, x = labels, color = publication), data = labelsdf)+
  geom_point(size = 3)+
  scale_x_discrete(breaks = c(0,1,2,3,4,5,6,7,8,9),
                   labels = c('1','2','3','4','5','6','7','8','9','10'))
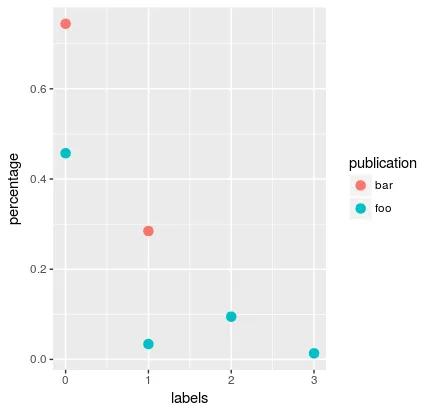
但是我的图形看起来像这样:
breaks或labels,也没有任何刻度标记。为什么我的刻度不显示?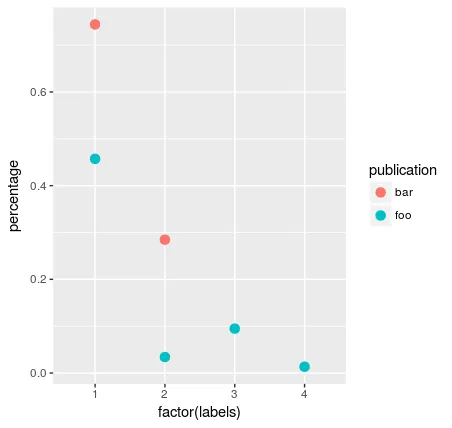
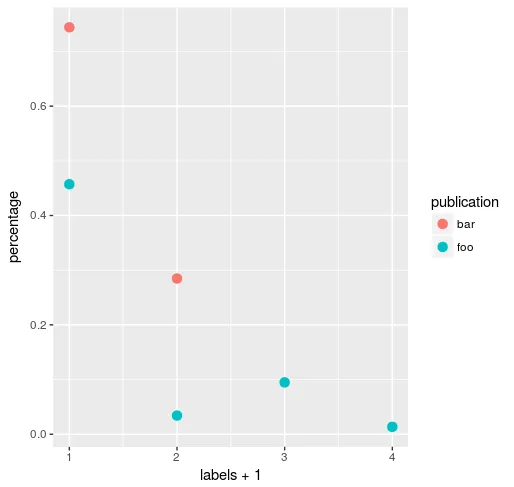
ggplot2? - Prradeplabel更改为labels。 - Prradep