我想在MATLAB中的图表上添加两个图例。我该怎么做?
4个回答
11
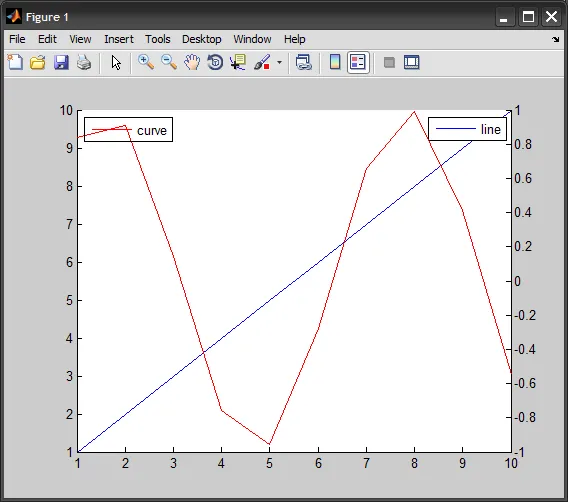
你可以创建第二个叠加的坐标轴,并具有自己的图例(当然,位置应该不同)。
编辑:
这是一个简单的示例:
%# create some plot with a legend
hAx(1) = axes();
hLine(1) = plot(1:10, 'Parent',hAx(1));
set(hAx(1), 'Box','off')
legend(hLine(1), 'line')

%# copy the axis
hAx(2) = copyobj(hAx(1),gcf);
delete( get(hAx(2),'Children') )            %# delete its children
hLine(2) = plot(sin(1:10), 'Color','r', 'Parent',hAx(2));
set(hAx(2), 'Color','none', 'XTick',[], ...
    'YAxisLocation','right', 'Box','off')   %# make it transparent
legend(hLine(2), {'curve'}, 'Location','NorthWest', 'Color','w')
- Amro
5
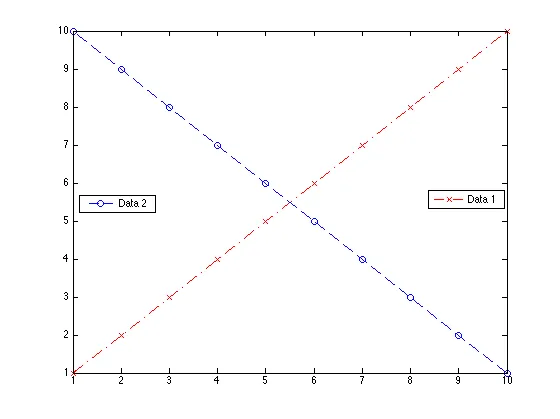
为了创建一个固定的图例,你可以调用
示例:
copyobj函数。handle_legend = legend(handle_plot, 'string1');
copyobj(handle_legend, handle_figure);
copyobj函数只是简单地在图形中保留其相关的图例。这适用于单个坐标轴(无需创建第二个叠加坐标轴),可以通过此方式添加多个图例。示例:
%declare figure
hfigure = figure('Color', 'w');

%plot 2 lines (red and blue)
hplot1 = plot(1:10,'r-.x');
hold on;
hplot2 = plot(10:-1:1,'b--o');

%plot legends
hlegend1 = legend(hplot1, 'Data 1', 'Location','East'); %display legend 1
new_handle = copyobj(hlegend1,hfigure);                 %copy legend 1 --> retain
legend(hplot2, 'Data 2', 'Location','West');            %display legend 2
- marsei
1
1这种方法在我的R2016a版本中不起作用,即使使用“legacy”选项也不行。 - tvo
1
在制作第一个图例之后,创建一个新的不可见的轴句柄:
ax=axes('Position',get(gca,'Position'),'Visible','Off');
现在在新轴上创建第二个图例:
legend(ax,...);
这基本上与@Amro的答案相同,但更简单,更短。
- tvo
1
我在R2016b中尝试了这个,但没有成功:Plot1; 调整xticks和yticks; 新建坐标轴; ...; 新的刻度和标签与旧的重叠。 - Jonas Stein
1
多图示例:
hAx(1) = axes();
hold on
hLine(1) = plot(1:10, 'Parent',hAx(1),'color','b');
hLine(2) = plot(3:15, 'Parent',hAx(1),'color','b', 'linestyle','--');
set(hAx(1), 'Box','off')
legend([hLine(1), hLine(2)],{ 'line' 'line2'})

%# copy the axis
hAx(2) = copyobj(hAx(1),gcf);
delete( get(hAx(2),'Children') )            %# delete its children
hold on
hLine(3) = plot(sin(1:10), 'Color','r','Parent',hAx(2));
hLine(4) = plot(cos(1:10), 'Color','r','linestyle','--','Parent',hAx(2));
hold off
set(hAx(2), 'Color','none', 'XTick',[], ...
'YAxisLocation','right', 'Box','off')   %# make it transparent
legend([hLine(3),hLine(4)], {'sin' , 'cos'}, 'Location','NorthWest', 'Color','w')
%legend(hLine(3), {'sin'}, 'Location','NorthWest', 'Color','w')
- houcinus
1
完全不明显,但这正是我在Octave中所需要的,谢谢:
legend([hLine(3),hLine(4)], {'sin' , 'cos'})。 - Josh.F网页内容由stack overflow 提供, 点击上面的可以查看英文原文,
原文链接
原文链接