将图例添加到rgl 3D图中

10

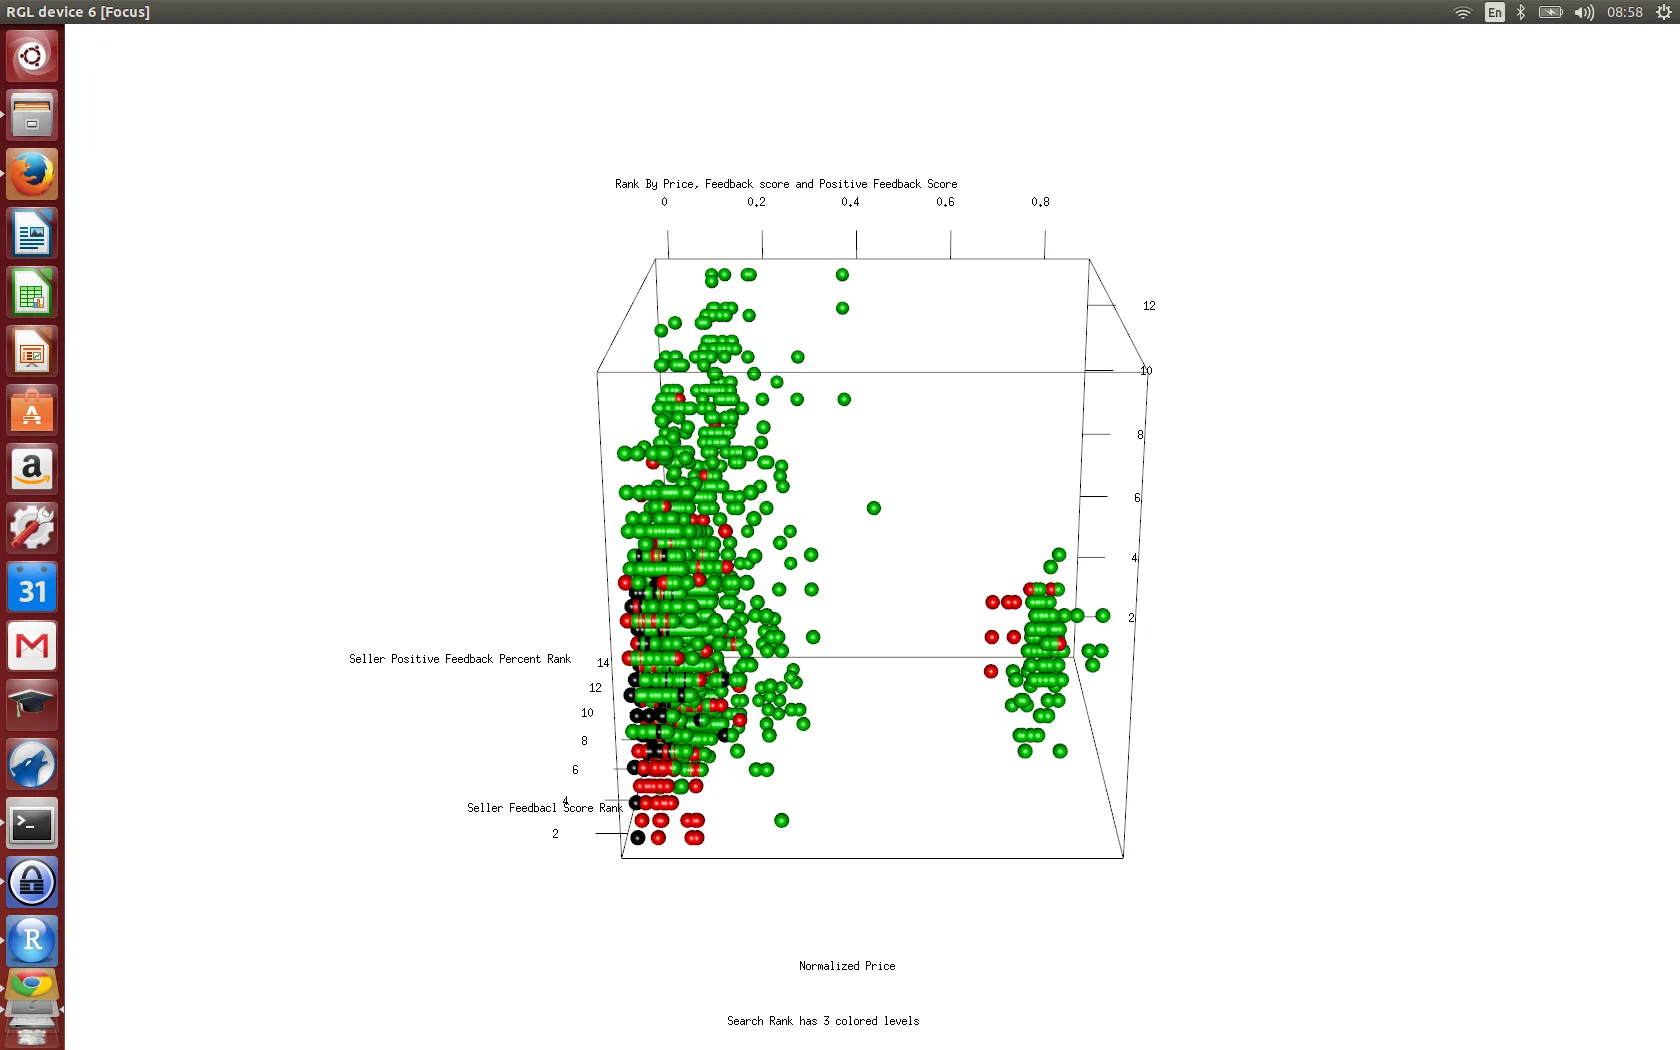
我正在尝试使用rgl绘制一个3D图,其中颜色图例表示哪个颜色对应哪个类别(称为'cut.rank'):

plot3d(
data.focus$normalized.price_shipping,
data.focus$seller_feedback_score_rank,
data.focus$seller_positive_feedback_percent_rank, 
col=as.factor(data.focus$cut.rank), 
size=1, 
type='s',
xlab = 'Normalized Price',
ylab = 'Seller Feedbacl Score Rank',
zlab = 'Seller Positive Feedback Percent Rank',
main = 'Rank By Price, Feedback score and Positive Feedback Score',
sub = 'Search Rank has 3 colored levels',
colkey = list(length = 0.5, width = 0.5, cex.clab = 0.75))
) 

但是我似乎无法在图中显示图例。(请参见附图)有什么想法吗?enter image description here

1个回答

23

我不确定colkey选项是否适用于plot3d函数。您可以使用legend3d来添加传统2D图表中的图例:

library(rgl)

#dummy data
set.seed(1)
x <- cumsum(rnorm(100))
y <- cumsum(rnorm(100))
z <- cumsum(rnorm(100))
cuts = cut(x = 1:length(x), breaks = 3)

# open 3d window
open3d()

# resize window
par3d(windowRect = c(100, 100, 612, 612))

# plot points
plot3d(x, y, z,
       col=rainbow(3)[cuts], 
       size = 2, type='s')

# add legend
legend3d("topright", legend = paste('Type', c('A', 'B', 'C')), pch = 16, col = rainbow(3), cex=1, inset=c(0.02))

# capture snapshot
snapshot3d(filename = '3dplot.png', fmt = 'png')

enter image description here

更新:在plot3D包中,colkeyscatter3D的一个参数(不同于rgl包中的plot3d函数)。你也可以使用这个参数:

library(plot3D)
scatter3D(x,y,z, col = rainbow(3)[cuts], colvar = NA, colkey = F, pch = 16)
legend("topright", paste('Type', c("A", "B", "C")), pch = 16, col = rainbow(3), cex=1, inset=c(0.02,0.2))

在这里输入图像描述


如果它是一个连续的图例,怎么办? - Jack Armstrong

网页内容由stack overflow 提供, 点击上面的
可以查看英文原文,
原文链接