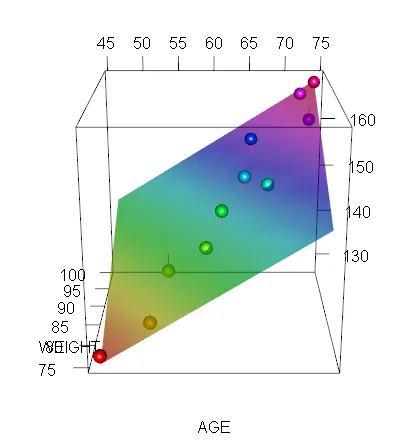
我在 rgl 中绘制了一张半透明平面穿过一群点的图表。我做到了这一步:
library(rgl)
BLOOD_PRESSURE=c(132,143,153,162,154,168,137,149,159,128,166)
AGE=c(52,59,67,73,64,74,54,61,65,46,72)
WEIGHT=c(78,83,87,95,88,99,85,85,93,75,98)
fit=lm(BLOOD_PRESSURE~AGE+WEIGHT)
npp=10
plot3d(x=AGE, y=WEIGHT, z=BLOOD_PRESSURE, type="s", col=rainbow(length(BLOOD_PRESSURE))[rank(BLOOD_PRESSURE)], radius=1, zlab="")
grd <- expand.grid(AGE=seq(min(AGE),max(AGE),length.out=npp),
                   WEIGHT=seq(min(WEIGHT),max(WEIGHT),length.out=npp) )
grd$pred <-predict(fit, newdata=grd)
persp3d(x=unique(grd[[1]]), y=unique(grd[[2]]),
        z=matrix(grd[[3]],npp,npp),  color="lightgrey",alpha=0.7, lit=T, back="lines", add=TRUE)
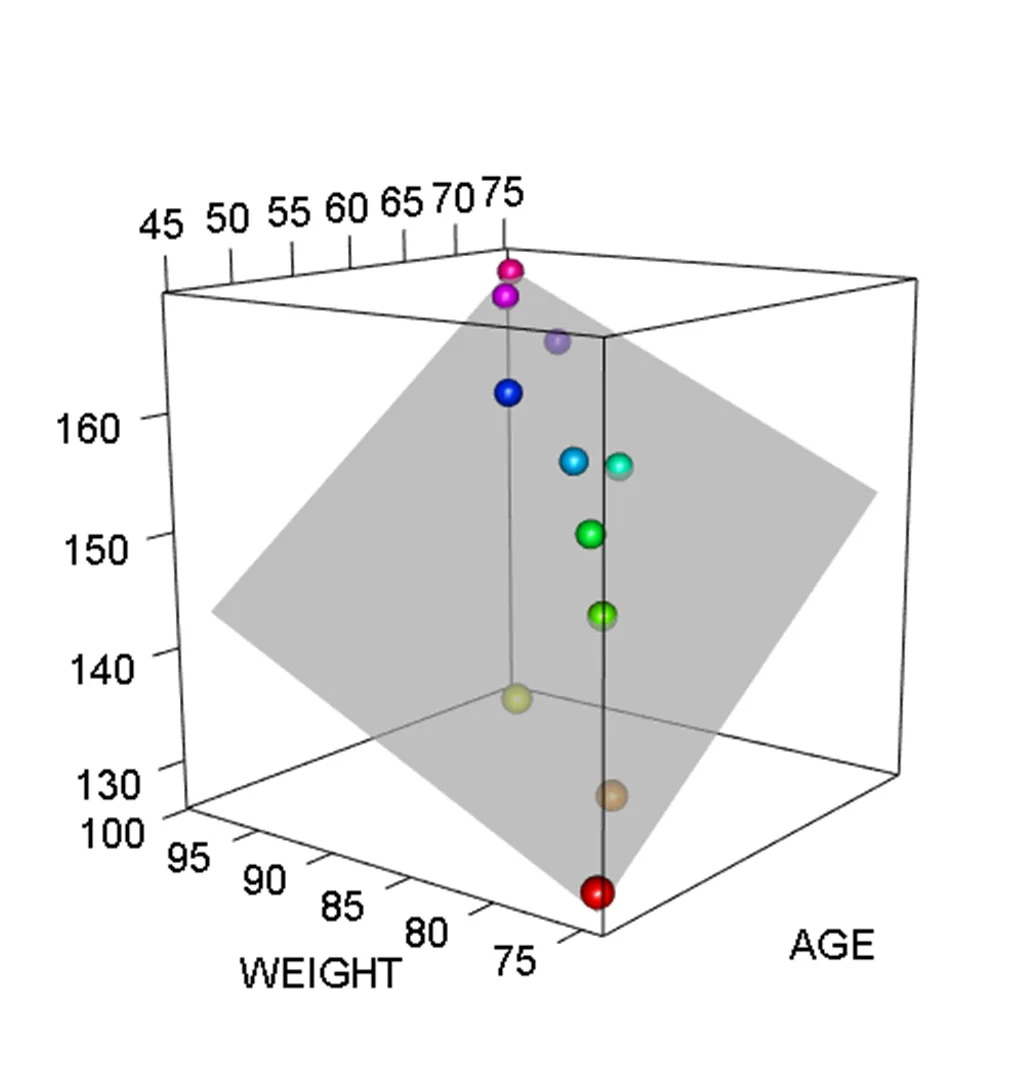
我想要改进或添加的内容如下:
- 在球体和拟合平面之间加虚线
- 在拟合平面上添加黑色网格
- 按Z值对拟合平面进行颜色编码
- 添加一个Z轴标签“血压”(但旋转到Z轴旁边)
有没有人知道我该如何实现这个?
编辑:根据下面答案的回应,我现在使用以下代码显示与实际数据点配合的(通用)线性模型拟合,使用Z轴颜色编码,并具有类似于包rockchalk中的plotPlane的语法:
plotPlaneFancy=function(model=NULL,plotx1=NULL,plotx2=NULL,plotPoints=T,plotDroplines=T,npp=50,x1lab=NULL,x2lab=NULL,ylab=NULL,x1lim=NULL,x2lim=NULL,cex=0.5,col.palette=NULL,segcol="darkgrey",interval="none",confcol="lightgrey",confalpha=0.4,lit=T,outfile="graph.png",aspect=c(1,1,0.7),zoom=1,userMatrix=matrix(c(0.80,-0.60,0.022,0,0.23,0.34,0.91,0,-0.55,-0.72,0.41,0,0,0,0,1),ncol=4,byrow=T),windowRect=c(0,29,1920,1032)) { # or library(colorRamps);col.palette <- matlab.like(1000)
library(rockchalk)
library(rgl)
library(colorRamps)
mf=model.frame(model);emf=rockchalk::model.data(model)
if (is.null(x1lab)) x1lab=plotx1
if (is.null(x2lab)) x2lab=plotx2
if (is.null(ylab)) ylab=names(mf)[[1]]
if (is.null(col.palette)) col.palette=rev(colorRampPalette(rainbow(13,s=0.9,v=0.8),bias=0.6,interpolate ="spline")(1000))
x1=emf[,plotx1]
x2=emf[,plotx2]
y=mf[,1]
if (is.null(x1lim)) x1lim=c(min(x1),max(x1))
if (is.null(x2lim)) x2lim=c(min(x2),max(x2))
preds=predictOMatic(model,predVals=c(plotx1,plotx2),n=npp,divider="seq",interval=interval)
ylim=c(min(c(preds$fit,y)),max(c(preds$fit,y)))
open3d(zoom=zoom,userMatrix=userMatrix,windowRect=windowRect)
if (plotPoints) plot3d(x=x1,y=x2,z=y,type="s",col=col.palette[(y-min(y))*999/diff(range(y))+1],radius=cex,aspect=aspect,xlab=x1lab,ylab=x2lab,zlab=ylab,lit=lit)
if (!plotPoints) plot3d(x=x1,y=x2,z=y,type="n",col=col.palette[(y-min(y))*999/diff(range(y))+1],radius=cex,aspect=aspect,xlab=x1lab,ylab=x2lab,zlab=ylab)
if ("lwr" %in% names(preds)) persp3d(x=unique(preds[,plotx1]),y=unique(preds[,plotx2]),z=matrix(preds[,"lwr"],npp,npp),color=confcol, alpha=confalpha, lit=lit, back="lines",add=TRUE)
ypred=matrix(preds[,"fit"],npp,npp)
cols=col.palette[(ypred-min(ypred))*999/diff(range(ypred))+1]
persp3d(x=unique(preds[,plotx1]),y=unique(preds[,plotx2]),z=ypred,color=cols, alpha=0.7, lit=lit, back="lines",add=TRUE)
if ("upr" %in% names(preds)) persp3d(x=unique(preds[,plotx1]),y=unique(preds[,plotx2]),z=matrix(preds[,"upr"],npp,npp),color=confcol, alpha=confalpha, lit=lit, back="lines",add=TRUE)
if (plotDroplines) segments3d(x=rep(x1,each=2),y=rep(x2,each=2),z=matrix(t(cbind(y,fitted(model))),nc=1),col=segcol,lty=2)
if (!is.null(outfile)) rgl.snapshot(outfile, fmt="png", top=TRUE)
}
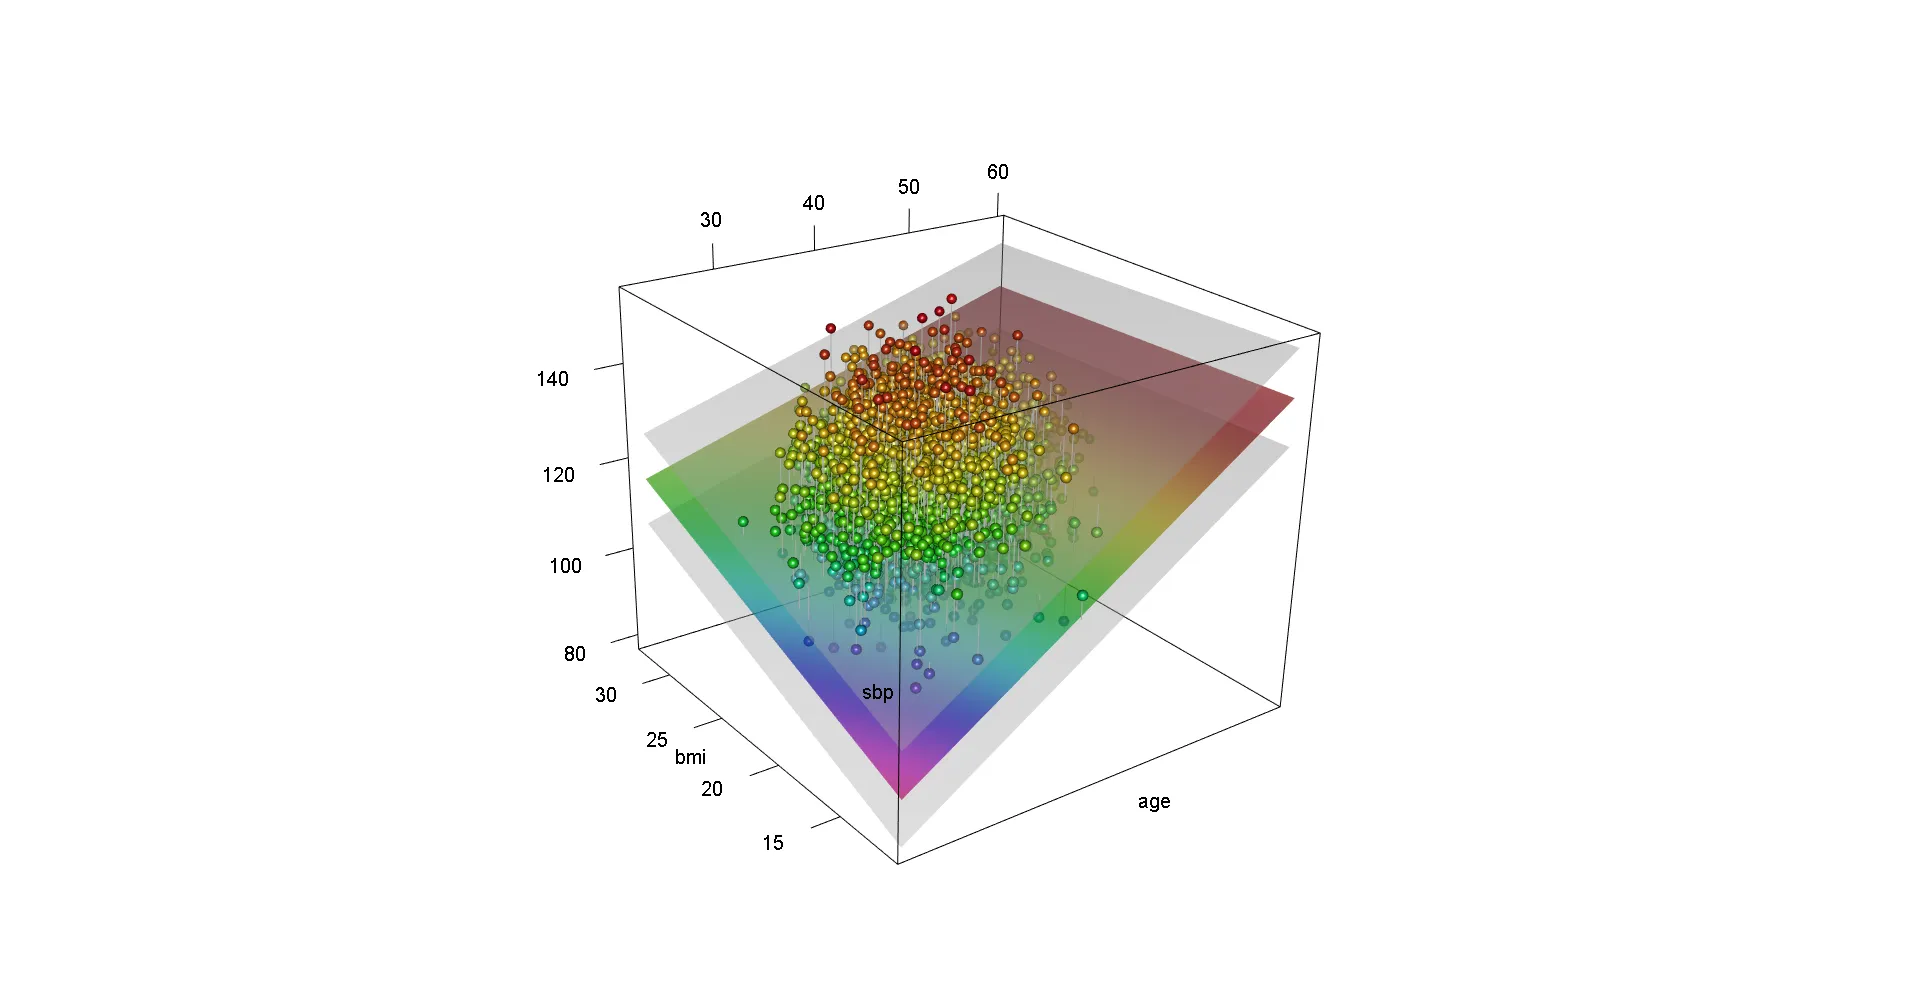
# simulate some data
n=10000
age=rnorm(n,mean=40,sd=5)
height=rnorm(n,mean=180,sd=7)
weight=-85+0.8*age+0.004*height^2+rnorm(n,mean=0,sd=7)
bmi=weight/((height/100)^2)
sbp=33+1.8*age+2.1*bmi-0.035*age*bmi+rnorm(n,mean=0,sd=5)
mydata=data.frame(cbind(age,height,weight,bmi,sbp))
fit1=lm(sbp~age*bmi,data=mydata)
plotPlaneFancy(fit1, plotx1 = "age", plotx2 = "bmi",cex=0.6)
plotPlaneFancy(fit1, plotx1 = "age", plotx2 = "bmi",cex=0.5,interval="confidence")
plotPlaneFancy(fit1, plotx1 = "age", plotx2 = "bmi",cex=0.5,interval="prediction")