我将尝试使用R的rgl包来为交互式3D图形添加一个固定的标题,但目前还没有成功。我还想在主标题下方添加一个副标题。
以下是示例代码:
如果你有一个好的/简单的方法将主标题放在固定位置(可能在下面添加一个副标题),那将会非常棒。提前感谢。
以下是示例代码:
library(rgl)
data<-read.table(text=" X Y Z
1 147.0883 -18.69122 -13.90000
2 147.0894 -18.69455 -10.97250
3 147.0883 -18.69122 -17.45000
4 147.0883 -18.69122 -15.44000
5 147.0883 -18.69122 -13.45000
6 147.0909 -18.69922 -12.25000
7 147.0883 -18.69122 -17.30000
8 147.0883 -18.69122 -16.40000
9 147.0883 -18.69122 -14.30000
10 147.0883 -18.69122 -18.50000
11 147.0883 -18.69122 -15.67606
12 147.0883 -18.69122 -17.25780
13 147.0883 -18.69122 -3.64000
14 147.1164 -18.68133 -22.13000
15 147.0883 -18.69122 -18.54778
16 147.0883 -18.69122 -15.50000
17 147.1185 -18.68691 -14.55500
18 147.0883 -18.69122 -18.12500
19 147.0901 -18.69670 -14.39767",header=T)
data
a<-as.matrix(data)
# call the plug-in bandwidth estimator
H.pi<-Hpi(a,binned=TRUE)*3 ## a is a matrix of x,y,z points
# calculate the kernel densities
fhat<-kde(a,H=H.pi)
# produce a 3D plot
open3d()
title<-"Individual 1 (male)" # main title
title2<-"Site A" # subtitle
plot(fhat,cont=c(50,95),colors=c("green","red"),drawpoints=TRUE,
xlab="",ylab="", zlab="",size=1.5,ptcol="black",
axes=F,box=T,aspect=c(1,1,0.5),zlim=c(-40,0))
axes3d(c("x--","y--","z-+"),cex=0.8)
mtext3d("Longitude",edge="x--",line=3,las=2,cex=1.1)
mtext3d("Latitude",edge="y--",line=3,las=2,cex=1.1)
mtext3d("Depth (m)",edge="z-+",line=3,las=2,cex=1.1)
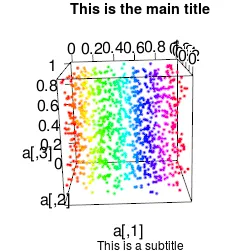
title3d(main=title,sub=title2,line=4)
我还没有找到一个好的方法,可以使我的标题(和子标题)固定不动,这样当我将我的图表导出成为3D电影时,主标题不会随着图表旋转。
movie3d(spin3d(axis=c(0,0,1), rpm=4),dir="~/Dropbox/R/Sample plots", duration=15, fps=10, movie="Plot 1")
如果你有一个好的/简单的方法将主标题放在固定位置(可能在下面添加一个副标题),那将会非常棒。提前感谢。
rgl中不可能实现。你可以考虑在使用其他软件创建电影后再添加标题。 - Bryan Hanson