您的代码中有两个问题(除了您使用 size 作为图例句柄的事实...这很危险,因为 size 是一个内置函数):
1) 只使用一个参数调用 legend 将返回一个指向图例对象的句柄,获取其位置实际上会给您盒子的位置,即文本+线条。
2) 使用以下行:
p(3) = p(3) - 0.06;
虽然修改了位置,但您需要使用类似以下代码来设置图例的新位置,以使更改生效:
set(HandleToLegend,'Position',p)
回到你的问题,诀窍是在调用
legend时分配多个输出;然后可以修改图例对象的特定元素。
实际上我们只需要4个输出参数中的1个,称为文档中的
icons,所以我会坚持这种表示法。然后,我们可以获取线条的
XData属性并按需修改它。实际上,
XData是一个2元向量:
[StartingPoint EndingPoint]
所以改变其中一个或两个(或者同时更改)将会改变图例框中显示的线条长度。
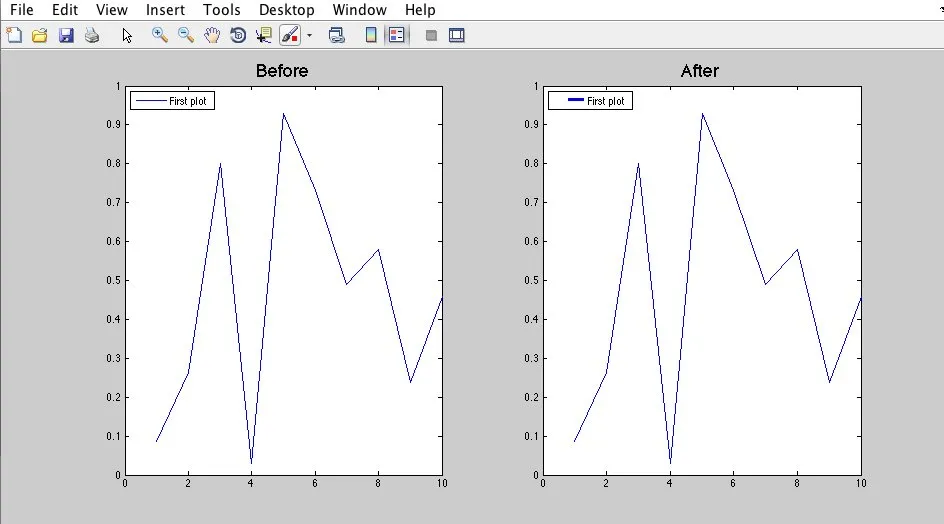
这里是完整的代码和注释;我改变了第二个图中线条的长度和宽度,以突出变化。
clear
clc
close all
x = 1:10;
y = rand(1,10);
figure;
subplot(1,2,1)
plot(x,y);
legend('First plot','Location','NorthWest');
title('Before','FontSize',18);
subplot(1,2,2)
plot(x,y);
title('After','FontSize',18);
[~,icons,~,~] = legend('First plot','Location','NorthWest');
i_1 = get(icons(1));
i_2 = get(icons(2));
i_3 = get(icons(3));
hline = icons(2);
LineData = get(hline,'XData')
NewData = [LineData(1)+.2 LineData(2)-.01];
set(hline,'XData',NewData,'LineWidth',3)
Which gives the following: