library(tidyverse)
library(ggrepel)
df <- structure(list(Fruit = c("Yellow Pear", "Yellow Pear", "Yellow Pear",
"Yellow Pear", "Yellow Pear", "Yellow Pear", "Yellow Pear", "Yellow Pear",
"Yellow Pear", "Yellow Pear", "Yellow Pear", "Yellow Pear", "Tropical Banana",
"Tropical Banana", "Tropical Banana", "Tropical Banana", "Tropical Banana",
"Tropical Banana", "Tropical Banana", "Tropical Banana", "Tropical Banana",
"Tropical Banana", "Tropical Banana", "Tropical Banana", "Farm Fresh Strawberries",
"Farm Fresh Strawberries", "Farm Fresh Strawberries", "Farm Fresh Strawberries",
"Farm Fresh Strawberries", "Farm Fresh Strawberries", "Farm Fresh Strawberries",
"Farm Fresh Strawberries", "Farm Fresh Strawberries", "Farm Fresh Strawberries",
"Farm Fresh Strawberries", "Farm Fresh Strawberries", "Melon Mango",
"Melon Mango", "Melon Mango", "Melon Mango", "Melon Mango", "Melon Mango",
"Melon Mango", "Melon Mango", "Melon Mango", "Melon Mango", "Melon Mango",
"Melon Mango", "Dragonfruit", "Dragonfruit", "Dragonfruit", "Dragonfruit",
"Dragonfruit", "Dragonfruit", "Dragonfruit", "Dragonfruit", "Dragonfruit",
"Dragonfruit", "Dragonfruit", "Dragonfruit", "Peaches", "Peaches",
"Peaches", "Peaches", "Peaches", "Peaches", "Peaches", "Peaches",
"Peaches", "Peaches", "Peaches", "Peaches", "Blueberry", "Blueberry",
"Blueberry", "Blueberry", "Blueberry", "Blueberry", "Blueberry",
"Blueberry", "Blueberry", "Blueberry", "Blueberry", "Blueberry",
"Blueberry GS", "Blueberry GS", "Blueberry GS", "Blueberry GS",
"Blueberry GS", "Blueberry GS", "Blueberry GS", "Blueberry GS",
"Blueberry GS", "Blueberry GS", "Blueberry GS", "Blueberry GS",
"Red Delicious Apples", "Red Delicious Apples", "Red Delicious Apples",
"Red Delicious Apples", "Red Delicious Apples", "Red Delicious Apples",
"Red Delicious Apples", "Red Delicious Apples", "Red Delicious Apples",
"Red Delicious Apples", "Red Delicious Apples", "Red Delicious Apples",
"Grapes", "Grapes", "Grapes", "Grapes", "Grapes", "Grapes", "Grapes",
"Grapes", "Grapes", "Grapes", "Grapes", "Grapes", "Cherry", "Cherry",
"Cherry", "Cherry", "Cherry", "Cherry", "Cherry", "Cherry", "Cherry",
"Cherry", "Cherry", "Cherry", "Green Apples", "Green Apples",
"Green Apples", "Green Apples", "Green Apples", "Green Apples",
"Green Apples", "Green Apples", "Green Apples", "Green Apples",
"Green Apples", "Green Apples", "Yellow Apples", "Yellow Apples",
"Yellow Apples", "Yellow Apples", "Yellow Apples", "Yellow Apples",
"Yellow Apples", "Yellow Apples", "Yellow Apples", "Yellow Apples",
"Yellow Apples", "Yellow Apples", "Perfect Punchy Pineapple",
"Perfect Punchy Pineapple", "Perfect Punchy Pineapple", "Perfect Punchy Pineapple",
"Perfect Punchy Pineapple", "Perfect Punchy Pineapple", "Perfect Punchy Pineapple",
"Perfect Punchy Pineapple", "Perfect Punchy Pineapple", "Perfect Punchy Pineapple",
"Perfect Punchy Pineapple", "Perfect Punchy Pineapple", "Watermelon",
"Watermelon", "Watermelon", "Watermelon", "Watermelon", "Watermelon",
"Watermelon", "Watermelon", "Watermelon", "Watermelon", "Watermelon",
"Watermelon", "Red Raspberry", "Red Raspberry", "Red Raspberry",
"Red Raspberry", "Red Raspberry", "Red Raspberry", "Red Raspberry",
"Red Raspberry", "Red Raspberry", "Red Raspberry", "Red Raspberry",
"Red Raspberry", "Blackberry", "Blackberry", "Blackberry", "Blackberry",
"Blackberry", "Blackberry", "Blackberry", "Blackberry", "Blackberry",
"Blackberry", "Blackberry", "Blackberry", "Avocado", "Avocado",
"Avocado", "Avocado", "Avocado", "Avocado", "Avocado", "Avocado",
"Avocado", "Avocado", "Avocado", "Avocado", "Cherimoya Custard Apple",
"Cherimoya Custard Apple", "Cherimoya Custard Apple", "Cherimoya Custard Apple",
"Cherimoya Custard Apple", "Cherimoya Custard Apple", "Cherimoya Custard Apple",
"Cherimoya Custard Apple", "Cherimoya Custard Apple", "Cherimoya Custard Apple",
"Cherimoya Custard Apple", "Cherimoya Custard Apple", "Nectarine",
"Nectarine", "Nectarine", "Nectarine", "Nectarine", "Nectarine",
"Nectarine", "Nectarine", "Nectarine", "Nectarine", "Nectarine",
"Nectarine", "Plum Prune Pineapple", "Plum Prune Pineapple",
"Plum Prune Pineapple", "Plum Prune Pineapple", "Plum Prune Pineapple",
"Plum Prune Pineapple", "Plum Prune Pineapple", "Plum Prune Pineapple",
"Plum Prune Pineapple", "Plum Prune Pineapple", "Plum Prune Pineapple",
"Plum Prune Pineapple", "Pomegranate", "Pomegranate", "Pomegranate",
"Pomegranate", "Pomegranate", "Pomegranate", "Pomegranate", "Pomegranate",
"Pomegranate", "Pomegranate", "Pomegranate", "Pomegranate", "Surinam Cherry",
"Surinam Cherry", "Surinam Cherry", "Surinam Cherry", "Surinam Cherry",
"Surinam Cherry", "Surinam Cherry", "Surinam Cherry", "Surinam Cherry",
"Surinam Cherry", "Surinam Cherry", "Surinam Cherry"), Date = structure(c(17622,
17652, 17683, 17713, 17744, 17775, 17805, 17836, 17866, 17897,
17928, 17956, 17622, 17652, 17683, 17713, 17744, 17775, 17805,
17836, 17866, 17897, 17928, 17956, 17622, 17652, 17683, 17713,
17744, 17775, 17805, 17836, 17866, 17897, 17928, 17956, 17622,
17652, 17683, 17713, 17744, 17775, 17805, 17836, 17866, 17897,
17928, 17956, 17622, 17652, 17683, 17713, 17744, 17775, 17805,
17836, 17866, 17897, 17928, 17956, 17622, 17652, 17683, 17713,
17744, 17775, 17805, 17836, 17866, 17897, 17928, 17956, 17622,
17652, 17683, 17713, 17744, 17775, 17805, 17836, 17866, 17897,
17928, 17956, 17622, 17652, 17683, 17713, 17744, 17775, 17805,
17836, 17866, 17897, 17928, 17956, 17622, 17652, 17683, 17713,
17744, 17775, 17805, 17836, 17866, 17897, 17928, 17956, 17622,
17652, 17683, 17713, 17744, 17775, 17805, 17836, 17866, 17897,
17928, 17956, 17622, 17652, 17683, 17713, 17744, 17775, 17805,
17836, 17866, 17897, 17928, 17956, 17622, 17652, 17683, 17713,
17744, 17775, 17805, 17836, 17866, 17897, 17928, 17956, 17622,
17652, 17683, 17713, 17744, 17775, 17805, 17836, 17866, 17897,
17928, 17956, 17622, 17652, 17683, 17713, 17744, 17775, 17805,
17836, 17866, 17897, 17928, 17956, 17622, 17652, 17683, 17713,
17744, 17775, 17805, 17836, 17866, 17897, 17928, 17956, 17622,
17652, 17683, 17713, 17744, 17775, 17805, 17836, 17866, 17897,
17928, 17956, 17622, 17652, 17683, 17713, 17744, 17775, 17805,
17836, 17866, 17897, 17928, 17956, 17622, 17652, 17683, 17713,
17744, 17775, 17805, 17836, 17866, 17897, 17928, 17956, 17622,
17652, 17683, 17713, 17744, 17775, 17805, 17836, 17866, 17897,
17928, 17956, 17622, 17652, 17683, 17713, 17744, 17775, 17805,
17836, 17866, 17897, 17928, 17956, 17622, 17652, 17683, 17713,
17744, 17775, 17805, 17836, 17866, 17897, 17928, 17956, 17622,
17652, 17683, 17713, 17744, 17775, 17805, 17836, 17866, 17897,
17928, 17956, 17622, 17652, 17683, 17713, 17744, 17775, 17805,
17836, 17866, 17897, 17928, 17956), class = "Date"), Value = c(0.00488,
0.00603, 0.00477, 0.00589, 0.00814, 0.00642, 0.00679, 0.00609,
0.00403, 0.00909, 0.00727, 0.0048, 0.02366, 0.01599, 0.01527,
0.0164, 0.01521, 0.01566, 0.01381, 0.01941, 0.0196, 0.02411,
0.02158, 0.02307, 0.02161, 0.02419, 0.02393, 0.01991, 0.0218,
0.02036, 0.01666, 0.02389, 0.01842, 0.02932, 0.01998, 0.02315,
0.04053, 0.04161, 0.04045, 0.04937, 0.03595, 0.03852, 0.04895,
0.03786, 0.03136, 0.04497, 0.03678, 0.04276, 0.00175, 0.00243,
0.00474, 0.00502, 0.00665, 0.00457, 0.00847, 0.00494, 0.00271,
0.00265, 0.00602, 0.00451, 0.03749, 0.0341, 0.03823, 0.0432,
0.04814, 0.03773, 0.03829, 0.0383, 0.03803, 0.04674, 0.03968,
0.04482, 0.25824, 0.2541, 0.26486, 0.32075, 0.26146, 0.27273,
0.28191, 0.23684, 0.22193, 0.29765, 0.30052, 0.31282, 0.0131,
0.02674, 0.01137, 0.01965, 0.02185, 0.02844, 0.02298, 0.02145,
0.02187, 0.03242, 0.02213, 0.02128, 0.05535, 0.0588, 0.05653,
0.05804, 0.04997, 0.05085, 0.05835, 0.05721, 0.05204, 0.06247,
0.06009, 0.06425, 0.275, 0.5, 0.4, 0.375, 0.45, 0.425, 0.275,
0.275, 0.225, 0.3, 0.325, 0.35, 0.25047, 0.26969, 0.23524, 0.21364,
0.23965, 0.21167, 0.2466, 0.2575, 0.22213, 0.23955, 0.22099,
0.20157, 0.01455, 0.01958, 0.0194, 0.01931, 0.01916, 0.01901,
0.02117, 0.02436, 0.03012, 0.02367, 0.0211, 0.01618, 0.03707,
0.03481, 0.03357, 0.03637, 0.04391, 0.03939, 0.03922, 0.05372,
0.03559, 0.05253, 0.04771, 0.04948, 0.09733, 0.12215, 0.11575,
0.10066, 0.11662, 0.09571, 0.09593, 0.11425, 0.09891, 0.13107,
0.11913, 0.12753, 0.16986, 0.17615, 0.21867, 0.18883, 0.18898,
0.22762, 0.135, 0.17317, 0.16945, 0.14858, 0.19451, 0.11659,
0.09441, 0.15135, 0.11804, 0.11181, 0.12594, 0.10972, 0.11313,
0.08373, 0.10206, 0.10558, 0.08821, 0.10629, 0.01472, 0.01466,
0.01521, 0.01733, 0.01718, 0.01489, 0.01457, 0.0174, 0.01009,
0.01713, 0.01636, 0.01198, 0.0687, 0.08581, 0.08247, 0.08407,
0.08265, 0.0785, 0.06906, 0.08113, 0.07246, 0.07717, 0.07311,
0.07862, 0.04762, 0.02301, 0.01534, 0.0291, 0.03063, 0.02757,
0.0229, 0.03049, 0.01524, 0.01524, 0.01979, 0.02435, 0.3038,
0.32317, 0.34615, 0.28571, 0.30423, 0.35196, 0.34341, 0.28165,
0.24615, 0.26303, 0.3, 0.28471, 0.20833, 0.21667, 0.28926, 0.29032,
0.31496, 0.18182, 0.31343, 0.26277, 0.23188, 0.26056, 0.24658,
0.21711, 0.24265, 0.38571, 0.22667, 0.24837, 0.29221, 0.27848,
0.2622, 0.28824, 0.26901, 0.29444, 0.2459, 0.3, 0.25843, 0.2809,
0.18436, 0.3352, 0.26816, 0.22222, 0.25556, 0.24309, 0.22099,
0.24309, 0.21547, 0.20879), Violation = c(FALSE, FALSE, FALSE,
FALSE, FALSE, FALSE, FALSE, FALSE, FALSE, FALSE, FALSE, FALSE,
TRUE, TRUE, TRUE, TRUE, TRUE, TRUE, TRUE, TRUE, TRUE, TRUE, TRUE,
TRUE, FALSE, FALSE, FALSE, FALSE, FALSE, FALSE, FALSE, FALSE,
FALSE, FALSE, FALSE, FALSE, FALSE, FALSE, FALSE, FALSE, FALSE,
FALSE, FALSE, FALSE, FALSE, FALSE, FALSE, FALSE, FALSE, FALSE,
FALSE, FALSE, FALSE, FALSE, FALSE, FALSE, FALSE, FALSE, FALSE,
FALSE, TRUE, TRUE, TRUE, TRUE, TRUE, TRUE, TRUE, TRUE, TRUE,
TRUE, TRUE, TRUE, FALSE, FALSE, FALSE, FALSE, FALSE, FALSE, FALSE,
FALSE, FALSE, FALSE, FALSE, FALSE, FALSE, FALSE, FALSE, FALSE,
FALSE, FALSE, FALSE, FALSE, FALSE, FALSE, FALSE, FALSE, TRUE,
TRUE, TRUE, TRUE, TRUE, TRUE, TRUE, TRUE, TRUE, TRUE, TRUE, TRUE,
FALSE, FALSE, FALSE, FALSE, FALSE, FALSE, FALSE, FALSE, FALSE,
FALSE, FALSE, FALSE, FALSE, FALSE, FALSE, FALSE, FALSE, FALSE,
FALSE, FALSE, FALSE, FALSE, FALSE, FALSE, FALSE, FALSE, FALSE,
FALSE, FALSE, FALSE, FALSE, FALSE, FALSE, FALSE, FALSE, FALSE,
TRUE, TRUE, TRUE, TRUE, TRUE, TRUE, TRUE, TRUE, TRUE, TRUE, TRUE,
TRUE, TRUE, TRUE, TRUE, TRUE, TRUE, TRUE, TRUE, TRUE, TRUE, TRUE,
TRUE, TRUE, FALSE, FALSE, FALSE, FALSE, FALSE, FALSE, FALSE,
FALSE, FALSE, FALSE, FALSE, FALSE, FALSE, FALSE, FALSE, FALSE,
FALSE, FALSE, FALSE, FALSE, FALSE, FALSE, FALSE, FALSE, FALSE,
FALSE, FALSE, FALSE, FALSE, FALSE, FALSE, FALSE, FALSE, FALSE,
FALSE, FALSE, FALSE, FALSE, FALSE, FALSE, FALSE, FALSE, FALSE,
FALSE, FALSE, FALSE, FALSE, FALSE, FALSE, FALSE, FALSE, FALSE,
FALSE, FALSE, FALSE, FALSE, FALSE, FALSE, FALSE, FALSE, FALSE,
FALSE, FALSE, FALSE, FALSE, FALSE, FALSE, FALSE, FALSE, FALSE,
FALSE, FALSE, FALSE, FALSE, FALSE, FALSE, FALSE, FALSE, FALSE,
FALSE, FALSE, FALSE, FALSE, FALSE, FALSE, FALSE, FALSE, FALSE,
FALSE, FALSE, FALSE, FALSE, FALSE, FALSE, FALSE, FALSE, FALSE,
FALSE, FALSE, FALSE, FALSE, FALSE, FALSE, FALSE, FALSE, FALSE,
FALSE, FALSE)), class = c("tbl_df", "tbl", "data.frame"), row.names = c(NA,
-276L)) %>%
  mutate(label = if_else(Date == max(Date), Fruit, NA_character_))

df
#> # A tibble: 276 x 5
#>    Fruit       Date         Value Violation label
#>    <chr>       <date>       <dbl> <lgl>     <chr>
#>  1 Yellow Pear 2018-04-01 0.00488 FALSE     NA
#>  2 Yellow Pear 2018-05-01 0.00603 FALSE     NA
#>  3 Yellow Pear 2018-06-01 0.00477 FALSE     NA
#>  4 Yellow Pear 2018-07-01 0.00589 FALSE     NA
#>  5 Yellow Pear 2018-08-01 0.00814 FALSE     NA
#>  6 Yellow Pear 2018-09-01 0.00642 FALSE     NA
#>  7 Yellow Pear 2018-10-01 0.00679 FALSE     NA
#>  8 Yellow Pear 2018-11-01 0.00609 FALSE     NA
#>  9 Yellow Pear 2018-12-01 0.00403 FALSE     NA
#> 10 Yellow Pear 2019-01-01 0.00909 FALSE     NA
#> # ... with 266 more rows
抱歉之前提供的数据框代码块太大了,请将其复制粘贴到R Studio中以开始工作。
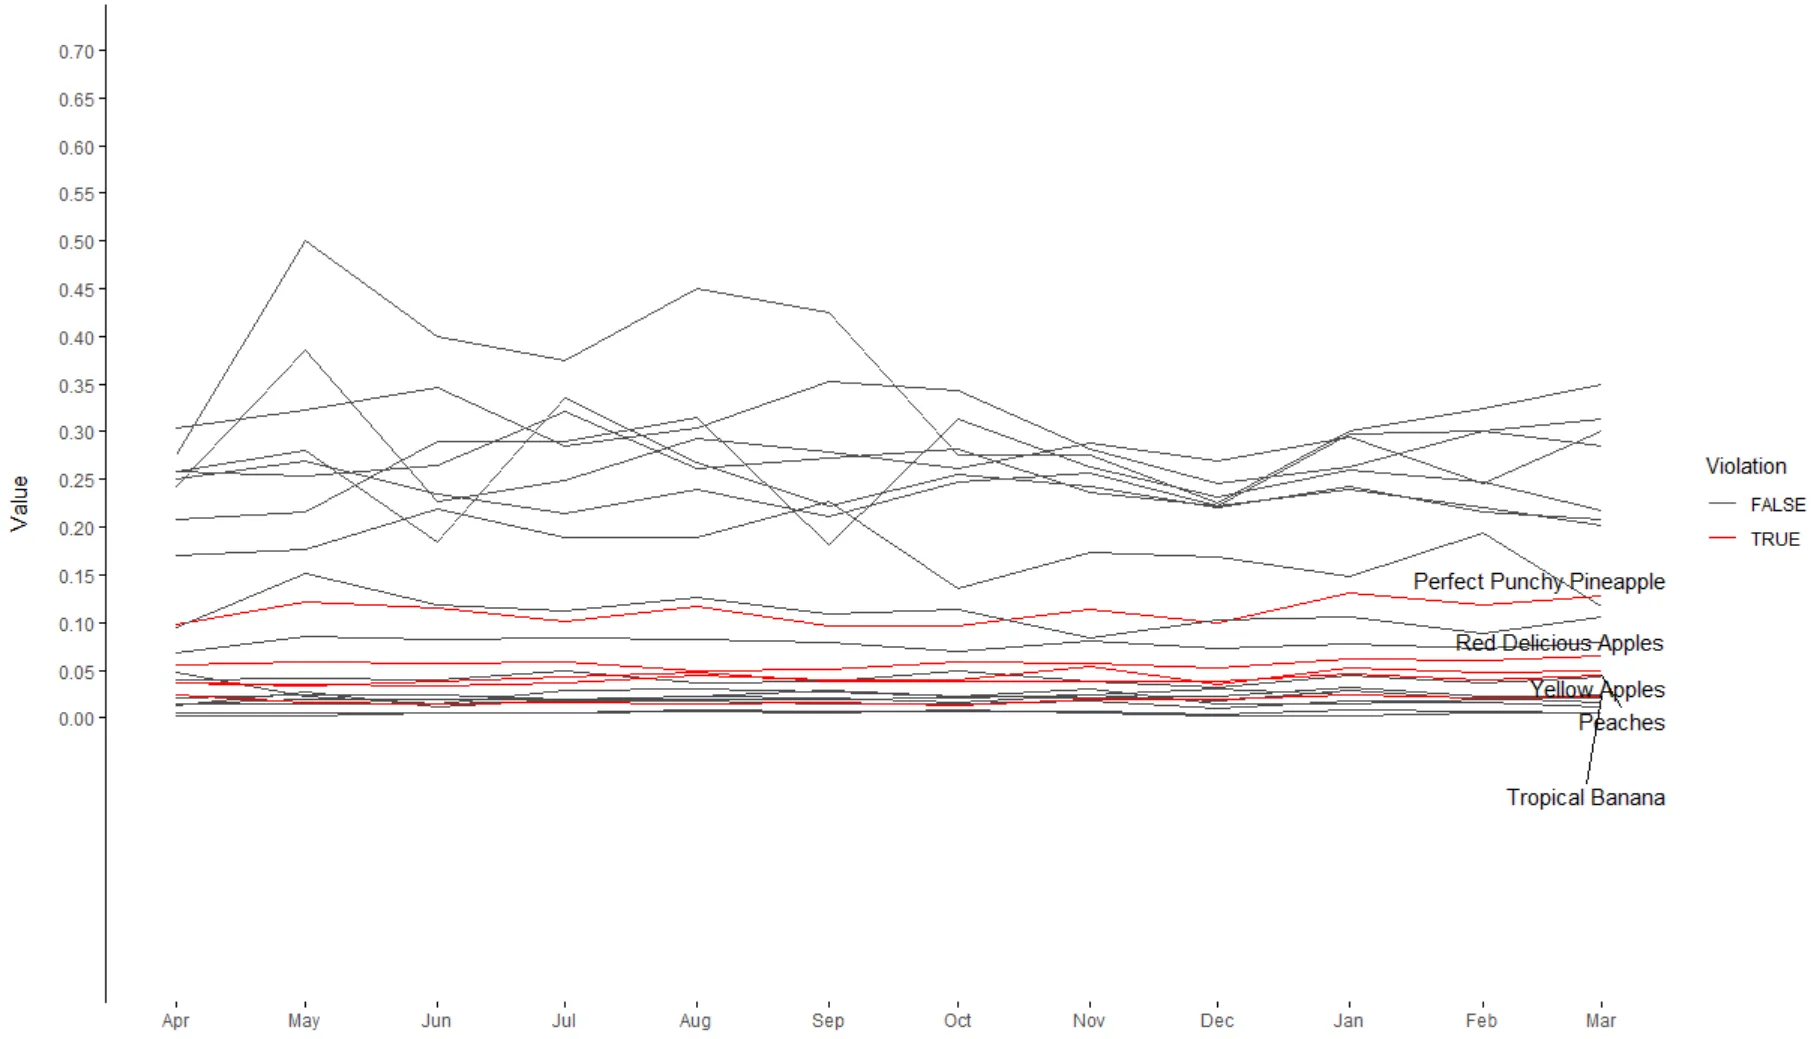
现在,我正在尝试使用ggrepel包来标记如下所示的红线。我已经在ggrepel中调整了各种参数,但没有得到想要的效果。我希望标签不会挡住图表,并排列在右侧,按照排名顺序。能否让标签也变成红色?
使用哪些ggrepel参数可以实现我的需求?或者是否有更好的方法在普通ggplot中实现这一点?
ggplot(df, aes(Date, Value, group = Fruit)) +
  geom_line(aes(color = Violation)) +
  scale_color_manual(values = c("grey30", "red")) +
  scale_x_date(breaks = "month", date_labels = "%b") +
  scale_y_continuous(breaks = seq(0, 0.7, by = 0.05)) +
  coord_cartesian(ylim = c(-0.25, 0.7)) +
  labs(x = NULL, y = "Value\n") +
  theme_minimal() +
  theme(panel.grid = element_blank(),
        axis.ticks.x = element_line(),
        #axis.line.x = element_blank(),
        axis.line.y = element_line(),
        axis.ticks.y = element_line()) +
  geom_text_repel(data = df %>% filter(Violation == TRUE),
                  aes(label = label),
                  direction = "y",
                  hjust = 0,
                  segment.size = 0.2,
                  nudge_x = 1,
                  na.rm = TRUE)
xlim = as.Date(c("2019-04-01", "2019-08-01"))参数,但似乎没有改变任何东西。不过还是谢谢你的提示。 - Display namecoord_cartesian(ylim = c(-0.25, 0.7), clip = "off")。 - Jon Spring