我正在使用ggdag包创建一些DAG图,该包是ggplot和ggrepel的包装器。由于文本无法适应节点大小,因此我使用了geom_dag_label_repel,这是ggrepel的geom_label_repel的包装器。
不幸的是,标签遮盖了箭头,这是不可接受的。我需要标签以一种清晰地显示箭头的方式进行排斥。我尝试过使用force_pull参数,但结果非常难以预测。我还尝试了其他一些方法:nudge_x/y似乎根本没有移动标签,使用position ='dodge'进行闪避也不起作用。
问题在于,我正在使用自定义函数生成图形,因此我希望任何排斥都能在函数内自动完成,这样当我提供坐标等信息时,标签就会出现在正确的位置,而无需为每个单独的图指定确切的位置。以下是一个reprex:
有没有办法避开箭头的标签?谢谢!
不幸的是,标签遮盖了箭头,这是不可接受的。我需要标签以一种清晰地显示箭头的方式进行排斥。我尝试过使用force_pull参数,但结果非常难以预测。我还尝试了其他一些方法:nudge_x/y似乎根本没有移动标签,使用position ='dodge'进行闪避也不起作用。
问题在于,我正在使用自定义函数生成图形,因此我希望任何排斥都能在函数内自动完成,这样当我提供坐标等信息时,标签就会出现在正确的位置,而无需为每个单独的图指定确切的位置。以下是一个reprex:
library(latex2exp)
library(tidyverse)
library(dagitty)
library(ggdag)
library(repr)
hj_ggdag <- function(x,
y,
names,
arcs = cbind(0,0),
title = "",
contraction = .1, #unused
add_functions = 0, #unused
add_functions_text = NULL, #unused
text_shift = .2*add_points, #unused
padding = 0, # padding around box if labels = T
length = 0.2, #unused
cex = 1, #unused
adj = .5, #unused
box = TRUE, #unused
model = NULL, #accepts causal model objects and returns ggdag
labels = FALSE,
textcol = 'white', # text colour (not label)
textsize = 3.88, #text size (not label)
force = 0, #repelling force between labels
...) { # other arguments passed to ggdag and geom_dag_label_repel, e.g. force_pull, node = T/F
# Step 1: First make the df
if (!is.null(model)) {
df <- tidy_dagitty(paste0('dag{',model$statement,'}'))
df$data <- df$data %>%
mutate(label = name)
} else {
# Operates on other arguments
# Placeholders
nodes <- LETTERS[1:length(names)]
# Coordinates
names(x) <- nodes
names(y) <- nodes
coords_df <- list(x = x , y = y) %>% coords2df
# Statement
statement <- paste(nodes[arcs[,1]], " -> ", nodes[arcs[,2]], collapse = "; ")
# DAG df
df <- paste("dag{", statement, "}") %>% dagitty
coordinates(df) <- coords2list(coords_df)
# imputing labels as an additional column so geom_dag_label_repel can accept it within the same aes
df <- df %>% tidy_dagitty
df$data <- df$data %>%
mutate(label = names %>% as.character %>% .[match(df$data$name,LETTERS)])
}
# Step 2: Format and export
p <- df %>%
ggdag(text = FALSE,...) + theme_dag() +
labs(title = TeX(repr_text(title) %>% str_remove_all('\\"')))
if (labels==TRUE){
parse <- ifelse(class(names)=='expression',TRUE,FALSE)
p +
geom_dag_label_repel(aes_string(label = 'label'),
show.legend = FALSE,
parse = parse,
box.padding = padding,
hjust = 0,
segment.color = 'red',
segment.size = 1,
min.segment.length=0,
...)
} else {
p +
geom_dag_text_repel(aes_string(label = 'label'),
show.legend = FALSE,
parse = TRUE,
color=textcol,
size=textsize,
box.padding = 0,
force = 0
)
}
}
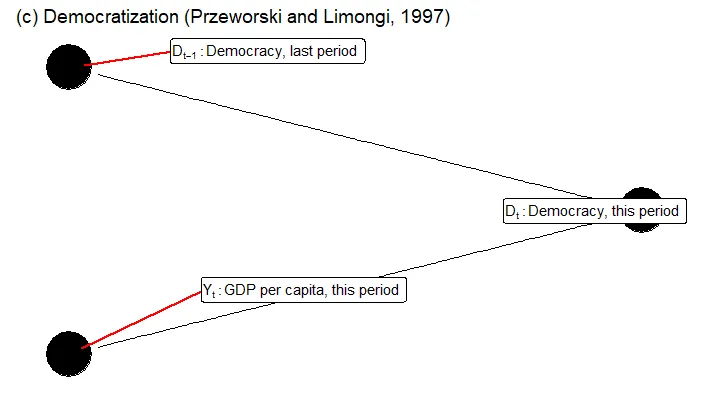
hj_ggdag(x = c(1,1,2),
y = c(2,0,1),
names = c(
expression(paste(D[t-1]: "Democracy, last period")),
expression(paste(Y[t]: "GDP per capita, this period")),
expression(paste(D[t]: "Democracy, this period"))
),
arcs = cbind( c(1,2),
c(3,3)),
title = "(c) Democratization (Przeworski and Limongi, 1997)",
add_functions = 0,
contraction = .16,
padding = 0,
labels = T,
force_pull=0
)
有没有办法避开箭头的标签?谢谢!