我想缩小绘图区域,以便为当前被截断的
ggrepel标签腾出更多空间。我似乎无法通过nudge_x()进一步偏移标签,也不想缩小文本大小。
我正在尝试找到一种压缩图表的方法,使得所有组都靠近中心,留下更多空间放置在x轴两端的标签。
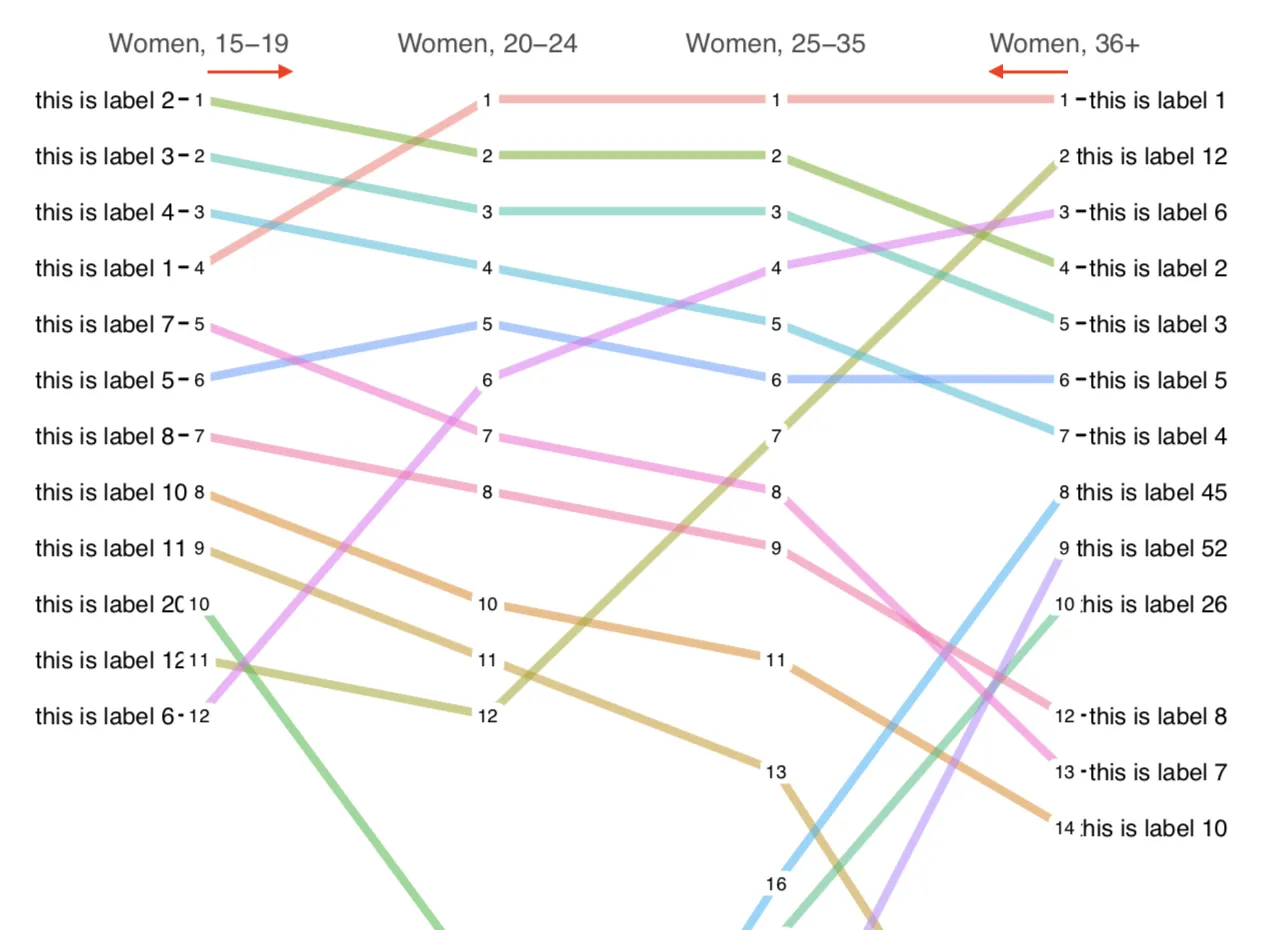
具体来说,我正在尝试将此图嵌入纵向PDF中。我尝试在代码块选项中控制fig.width,但这只会使整个图表变小。
我希望在纵向页面上最大化宽度,但相对于标签区域缩小绘图区域。
---
title             : "The title"
shorttitle        : "Title"

author:
  - name          : "Me"
    affiliation   : "1"
    corresponding : yes    # Define only one corresponding author
    address       : "Address"
    email         : "email"

affiliation:
  - id            : "1"
    institution   : "Company"

authornote: |
  Note here

abstract: |
  Abstract here.


floatsintext      : yes
figurelist        : no
tablelist         : no
footnotelist      : no
linenumbers       : no
mask              : no
draft             : no
note              : "\\clearpage"

documentclass     : "apa6"
classoption       : "man,noextraspace"
header-includes:
  - \usepackage{pdfpages}
  - \usepackage{setspace}
  - \AtBeginEnvironment{tabular}{\singlespacing}
  - \makeatletter\let\expandableinput\@@input\makeatother
  - \interfootnotelinepenalty=10000
  - \usepackage{float} #use the 'float' package
  - \floatplacement{figure}{H} #make every figure with caption = h
  - \raggedbottom
output            : papaja::apa6_pdf
---


```{r test, fig.cap="Caption.", fig.height=8, include=TRUE, echo=FALSE}
library("papaja")
library(tidyverse)
library(ggrepel)

ageGenderF <- structure(list(genAge = structure(c(1L, 1L, 1L, 1L, 1L, 1L, 1L,
1L, 1L, 1L, 1L, 1L, 1L, 1L, 1L, 1L, 1L, 1L, 1L, 1L, 1L, 1L, 1L,
1L, 1L, 1L, 1L, 1L, 1L, 1L, 1L, 1L, 1L, 1L, 1L, 1L, 1L, 1L, 1L,
1L, 1L, 1L, 1L, 1L, 1L, 1L, 1L, 1L, 1L, 1L, 1L, 1L, 1L, 1L, 1L,
1L, 1L, 1L, 1L, 1L, 1L, 1L, 1L, 1L, 2L, 2L, 2L, 2L, 2L, 2L, 2L,
2L, 2L, 2L, 2L, 2L, 2L, 2L, 2L, 2L, 2L, 2L, 2L, 2L, 2L, 2L, 2L,
2L, 2L, 2L, 2L, 2L, 2L, 2L, 2L, 2L, 2L, 2L, 2L, 2L, 2L, 2L, 2L,
2L, 2L, 2L, 2L, 2L, 2L, 2L, 2L, 2L, 2L, 2L, 2L, 2L, 2L, 2L, 2L,
2L, 2L, 2L, 2L, 2L, 2L, 2L, 2L, 2L, 3L, 3L, 3L, 3L, 3L, 3L, 3L,
3L, 3L, 3L, 3L, 3L, 3L, 3L, 3L, 3L, 3L, 3L, 3L, 3L, 3L, 3L, 3L,
3L, 3L, 3L, 3L, 3L, 3L, 3L, 3L, 3L, 3L, 3L, 3L, 3L, 3L, 3L, 3L,
3L, 3L, 3L, 3L, 3L, 3L, 3L, 3L, 3L, 3L, 3L, 3L, 3L, 3L, 3L, 3L,
3L, 3L, 3L, 3L, 3L, 3L, 3L, 3L, 3L, 4L, 4L, 4L, 4L, 4L, 4L, 4L,
4L, 4L, 4L, 4L, 4L, 4L, 4L, 4L, 4L, 4L, 4L, 4L, 4L, 4L, 4L, 4L,
4L, 4L, 4L, 4L, 4L, 4L, 4L, 4L, 4L, 4L, 4L, 4L, 4L, 4L, 4L, 4L,
4L, 4L, 4L, 4L, 4L, 4L, 4L, 4L, 4L, 4L, 4L, 4L, 4L, 4L, 4L, 4L,
4L, 4L, 4L, 4L, 4L, 4L, 4L, 4L, 4L), .Label = c("Women, 15-19",
"Women, 20-24", "Women, 25-35", "Women, 36+"), class = "factor"),
    word_ = c("this is label 2", "this is label 3", "this is label 4",
    "this is label 1", "this is label 7", "this is label 5",
    "this is label 8", "this is label 10", "this is label 11",
    "this is label 20", "this is label 12", "this is label 6",
    "this is label 17", "this is label 9", "this is label 15",
    "this is label 21", "this is label 31", "this is label 25",
    "this is label 26", "this is label 19", "this is label 24",
    "this is label 28", "this is label 29", "this is label 30",
    "this is label 14", "this is label 22", "this is label 18",
    "this is label 54", "this is label 32", "this is label 44",
    "this is label 52", "this is label 34", "this is label 59",
    "this is label 48", "this is label 23", "this is label 47",
    "this is label 38", "this is label 35", "this is label 61",
    "this is label 56", "this is label 39", "this is label 72",
    "this is label 42", "this is label 16", "this is label 66",
    "this is label 37", "this is label 51", "this is label 27",
    "this is label 40", "this is label 73", "this is label 60",
    "this is label 113", "this is label 50", "this is label 45",
    "this is label 81", "this is label 84", "this is label 53",
    "this is label 49", "this is label 67", "this is label 68",
    "this is label 46", "this is label 65", "this is label 41",
    "this is label 57", "this is label 1", "this is label 2",
    "this is label 3", "this is label 4", "this is label 5",
    "this is label 6", "this is label 7", "this is label 8",
    "this is label 9", "this is label 10", "this is label 11",
    "this is label 12", "this is label 13", "this is label 14",
    "this is label 15", "this is label 16", "this is label 17",
    "this is label 18", "this is label 19", "this is label 20",
    "this is label 21", "this is label 22", "this is label 23",
    "this is label 24", "this is label 25", "this is label 26",
    "this is label 27", "this is label 28", "this is label 29",
    "this is label 30", "this is label 31", "this is label 32",
    "this is label 33", "this is label 34", "this is label 35",
    "this is label 36", "this is label 37", "this is label 38",
    "this is label 39", "this is label 40", "this is label 41",
    "this is label 42", "this is label 43", "this is label 44",
    "this is label 45", "this is label 46", "this is label 47",
    "this is label 48", "this is label 49", "this is label 50",
    "this is label 51", "this is label 52", "this is label 53",
    "this is label 54", "this is label 55", "this is label 56",
    "this is label 57", "this is label 58", "this is label 59",
    "this is label 60", "this is label 61", "this is label 62",
    "this is label 63", "this is label 64", "this is label 1",
    "this is label 2", "this is label 3", "this is label 6",
    "this is label 4", "this is label 5", "this is label 12",
    "this is label 7", "this is label 8", "this is label 9",
    "this is label 10", "this is label 14", "this is label 11",
    "this is label 18", "this is label 29", "this is label 45",
    "this is label 27", "this is label 15", "this is label 26",
    "this is label 71", "this is label 37", "this is label 13",
    "this is label 25", "this is label 23", "this is label 22",
    "this is label 41", "this is label 42", "this is label 55",
    "this is label 52", "this is label 36", "this is label 34",
    "this is label 17", "this is label 63", "this is label 24",
    "this is label 19", "this is label 28", "this is label 38",
    "this is label 32", "this is label 21", "this is label 30",
    "this is label 35", "this is label 16", "this is label 64",
    "this is label 20", "this is label 31", "this is label 53",
    "this is label 77", "this is label 39", "this is label 70",
    "this is label 57", "this is label 48", "this is label 43",
    "this is label 132", "this is label 51", "this is label 66",
    "this is label 58", "this is label 85", "this is label 120",
    "this is label 65", "this is label 40", "this is label 121",
    "this is label 78", "this is label 59", "this is label 141",
    "this is label 1", "this is label 12", "this is label 6",
    "this is label 2", "this is label 3", "this is label 5",
    "this is label 4", "this is label 45", "this is label 52",
    "this is label 26", "this is label 77", "this is label 8",
    "this is label 7", "this is label 10", "this is label 14",
    "this is label 31", "this is label 59", "this is label 178",
    "this is label 18", "this is label 27", "this is label 42",
    "this is label 70", "this is label 29", "this is label 37",
    "this is label 330", "this is label 78", "this is label 25",
    "this is label 34", "this is label 21", "this is label 450",
    "this is label 83", "this is label 185", "this is label 57",
    "this is label 16", "this is label 50", "this is label 126",
    "this is label 895", "this is label 63", "this is label 402",
    "this is label 19", "this is label 724", "this is label 40",
    "this is label 11", "this is label 43", "this is label 758",
    "this is label 1099", "this is label 73", "this is label 62",
    "this is label 46", "this is label 183", "this is label 819",
    "this is label 295", "this is label 1100", "this is label 17",
    "this is label 282", "this is label 153", "this is label 1101",
    "this is label 41", "this is label 1102", "this is label 446",
    "this is label 216", "this is label 13", "this is label 109",
    "this is label 20"), n = c(774L, 635L, 618L, 495L, 329L,
    284L, 259L, 217L, 197L, 181L, 163L, 163L, 162L, 160L, 138L,
    124L, 114L, 112L, 110L, 107L, 99L, 98L, 97L, 92L, 85L, 84L,
    84L, 78L, 74L, 72L, 68L, 67L, 66L, 66L, 65L, 60L, 60L, 60L,
    58L, 57L, 55L, 51L, 51L, 51L, 50L, 50L, 48L, 47L, 47L, 46L,
    46L, 44L, 44L, 44L, 43L, 43L, 43L, 43L, 42L, 41L, 41L, 41L,
    41L, 41L, 1568L, 1366L, 1220L, 1012L, 687L, 682L, 633L, 516L,
    464L, 374L, 372L, 326L, 326L, 304L, 293L, 292L, 274L, 261L,
    259L, 257L, 236L, 232L, 229L, 223L, 223L, 221L, 221L, 213L,
    210L, 205L, 198L, 191L, 189L, 167L, 165L, 164L, 146L, 142L,
    140L, 140L, 139L, 136L, 134L, 129L, 122L, 121L, 115L, 115L,
    115L, 113L, 112L, 110L, 110L, 109L, 107L, 104L, 103L, 102L,
    99L, 99L, 99L, 97L, 96L, 93L, 426L, 332L, 310L, 290L, 197L,
    166L, 147L, 134L, 125L, 113L, 105L, 104L, 97L, 83L, 78L,
    77L, 77L, 74L, 69L, 69L, 69L, 69L, 68L, 61L, 61L, 59L, 59L,
    58L, 58L, 58L, 57L, 57L, 56L, 54L, 51L, 48L, 47L, 46L, 43L,
    42L, 38L, 38L, 36L, 34L, 34L, 33L, 32L, 32L, 32L, 32L, 31L,
    29L, 29L, 28L, 28L, 27L, 27L, 27L, 27L, 27L, 26L, 26L, 25L,
    24L, 37L, 26L, 26L, 20L, 19L, 18L, 17L, 15L, 14L, 12L, 12L,
    12L, 12L, 12L, 11L, 10L, 9L, 9L, 9L, 9L, 8L, 7L, 7L, 7L,
    7L, 7L, 7L, 6L, 6L, 6L, 6L, 6L, 6L, 6L, 5L, 5L, 5L, 5L, 5L,
    5L, 5L, 5L, 5L, 4L, 4L, 4L, 4L, 4L, 4L, 4L, 4L, 4L, 4L, 4L,
    4L, 4L, 4L, 4L, 4L, 4L, 4L, 4L, 4L, 3L), rank = c(1L, 2L,
    3L, 4L, 5L, 6L, 7L, 8L, 9L, 10L, 11L, 12L, 13L, 14L, 15L,
    16L, 17L, 18L, 19L, 20L, 21L, 22L, 23L, 24L, 25L, 26L, 27L,
    28L, 29L, 30L, 31L, 32L, 33L, 34L, 35L, 36L, 37L, 38L, 39L,
    40L, 41L, 42L, 43L, 44L, 45L, 46L, 47L, 48L, 49L, 50L, 51L,
    52L, 53L, 54L, 55L, 56L, 57L, 58L, 59L, 60L, 61L, 62L, 63L,
    64L, 1L, 2L, 3L, 4L, 5L, 6L, 7L, 8L, 9L, 10L, 11L, 12L, 13L,
    14L, 15L, 16L, 17L, 18L, 19L, 20L, 21L, 22L, 23L, 24L, 25L,
    26L, 27L, 28L, 29L, 30L, 31L, 32L, 33L, 34L, 35L, 36L, 37L,
    38L, 39L, 40L, 41L, 42L, 43L, 44L, 45L, 46L, 47L, 48L, 49L,
    50L, 51L, 52L, 53L, 54L, 55L, 56L, 57L, 58L, 59L, 60L, 61L,
    62L, 63L, 64L, 1L, 2L, 3L, 4L, 5L, 6L, 7L, 8L, 9L, 10L, 11L,
    12L, 13L, 14L, 15L, 16L, 17L, 18L, 19L, 20L, 21L, 22L, 23L,
    24L, 25L, 26L, 27L, 28L, 29L, 30L, 31L, 32L, 33L, 34L, 35L,
    36L, 37L, 38L, 39L, 40L, 41L, 42L, 43L, 44L, 45L, 46L, 47L,
    48L, 49L, 50L, 51L, 52L, 53L, 54L, 55L, 56L, 57L, 58L, 59L,
    60L, 61L, 62L, 63L, 64L, 1L, 2L, 3L, 4L, 5L, 6L, 7L, 8L,
    9L, 10L, 11L, 12L, 13L, 14L, 15L, 16L, 17L, 18L, 19L, 20L,
    21L, 22L, 23L, 24L, 25L, 26L, 27L, 28L, 29L, 30L, 31L, 32L,
    33L, 34L, 35L, 36L, 37L, 38L, 39L, 40L, 41L, 42L, 43L, 44L,
    45L, 46L, 47L, 48L, 49L, 50L, 51L, 52L, 53L, 54L, 55L, 56L,
    57L, 58L, 59L, 60L, 61L, 62L, 63L, 64L)), class = c("grouped_df",
"tbl_df", "tbl", "data.frame"), row.names = c(NA, -256L), groups = structure(list(
    genAge = structure(1:4, .Label = c("Women, 15-19", "Women, 20-24",
    "Women, 25-35", "Women, 36+"), class = "factor"), .rows = list(
        1:64, 65:128, 129:192, 193:256)), row.names = c(NA, -4L
), class = c("tbl_df", "tbl", "data.frame"), .drop = TRUE))

ageGenderFLow <-
  ageGenderF %>%
  filter(genAge=="Women, 15-19") %>%
  filter(rank<=10)

ageGenderFHigh <-
  ageGenderF %>%
  filter(genAge=="Women, 36+") %>%
  filter(rank<=10)

ageGenderF_ <-
  ageGenderF %>%
  filter(word_ %in% ageGenderFLow$word_ |
         word_ %in% ageGenderFHigh$word_)

# get rank order of words for low set
ageGenderFLowRank <-
  ageGenderF_ %>%
  filter(genAge=="Women, 15-19") %>%
  arrange(rank) %>%
  mutate(order = 1:n())

ageGenderF_ %>%
  mutate(word = factor(word_, ordered=TRUE, levels=ageGenderFLowRank$word_)) %>%
  # https://ibecav.github.io/slopegraph/
  ggplot(., aes(x = genAge, y = reorder(rank, -rank), group = word_)) +
  geom_line(aes(color = word_, alpha = 1), size = 1.5) +
  #geom_line(size = 0.5, color="lightgrey") +
  geom_text_repel(data = . %>% filter(genAge == "Women, 15-19"),
                  aes(label = word) ,
                  hjust = "left",
                  #fontface = "bold",
                  size = 3,
                  nudge_x = -3,
                  direction = "y") +
  geom_text_repel(data = . %>% filter(genAge == "Women, 36+"),
                  aes(label = word) ,
                  hjust = "right",
                  #fontface = "bold",
                  size = 3,
                  nudge_x = 3,
                  direction = "y") +
  geom_label(aes(label = rank),
             size = 2.5,
             label.padding = unit(0.15, "lines"),
             label.size = 0.0) +
  scale_x_discrete(position = "top") +
  theme_bw() +
  # Remove the legend
  theme(legend.position = "none") +
  # Remove the panel border
  theme(panel.border     = element_blank()) +
  # Remove just about everything from the y axis
  theme(axis.title.y     = element_blank()) +
  theme(axis.text.y      = element_blank()) +
  theme(panel.grid.major.y = element_blank()) +
  theme(panel.grid.minor.y = element_blank()) +
  # Remove a few things from the x axis and increase font size
  theme(axis.title.x     = element_blank()) +
  theme(panel.grid.major.x = element_blank()) +
  theme(axis.text.x.top      = element_text(size=10)) +
  # Remove x & y tick marks
  theme(axis.ticks       = element_blank()) +
  # Format title & subtitle
  theme(plot.title       = element_text(size=10, face = "bold", hjust = 0.5)) +
  theme(plot.subtitle    = element_text(hjust = 0.5))
```
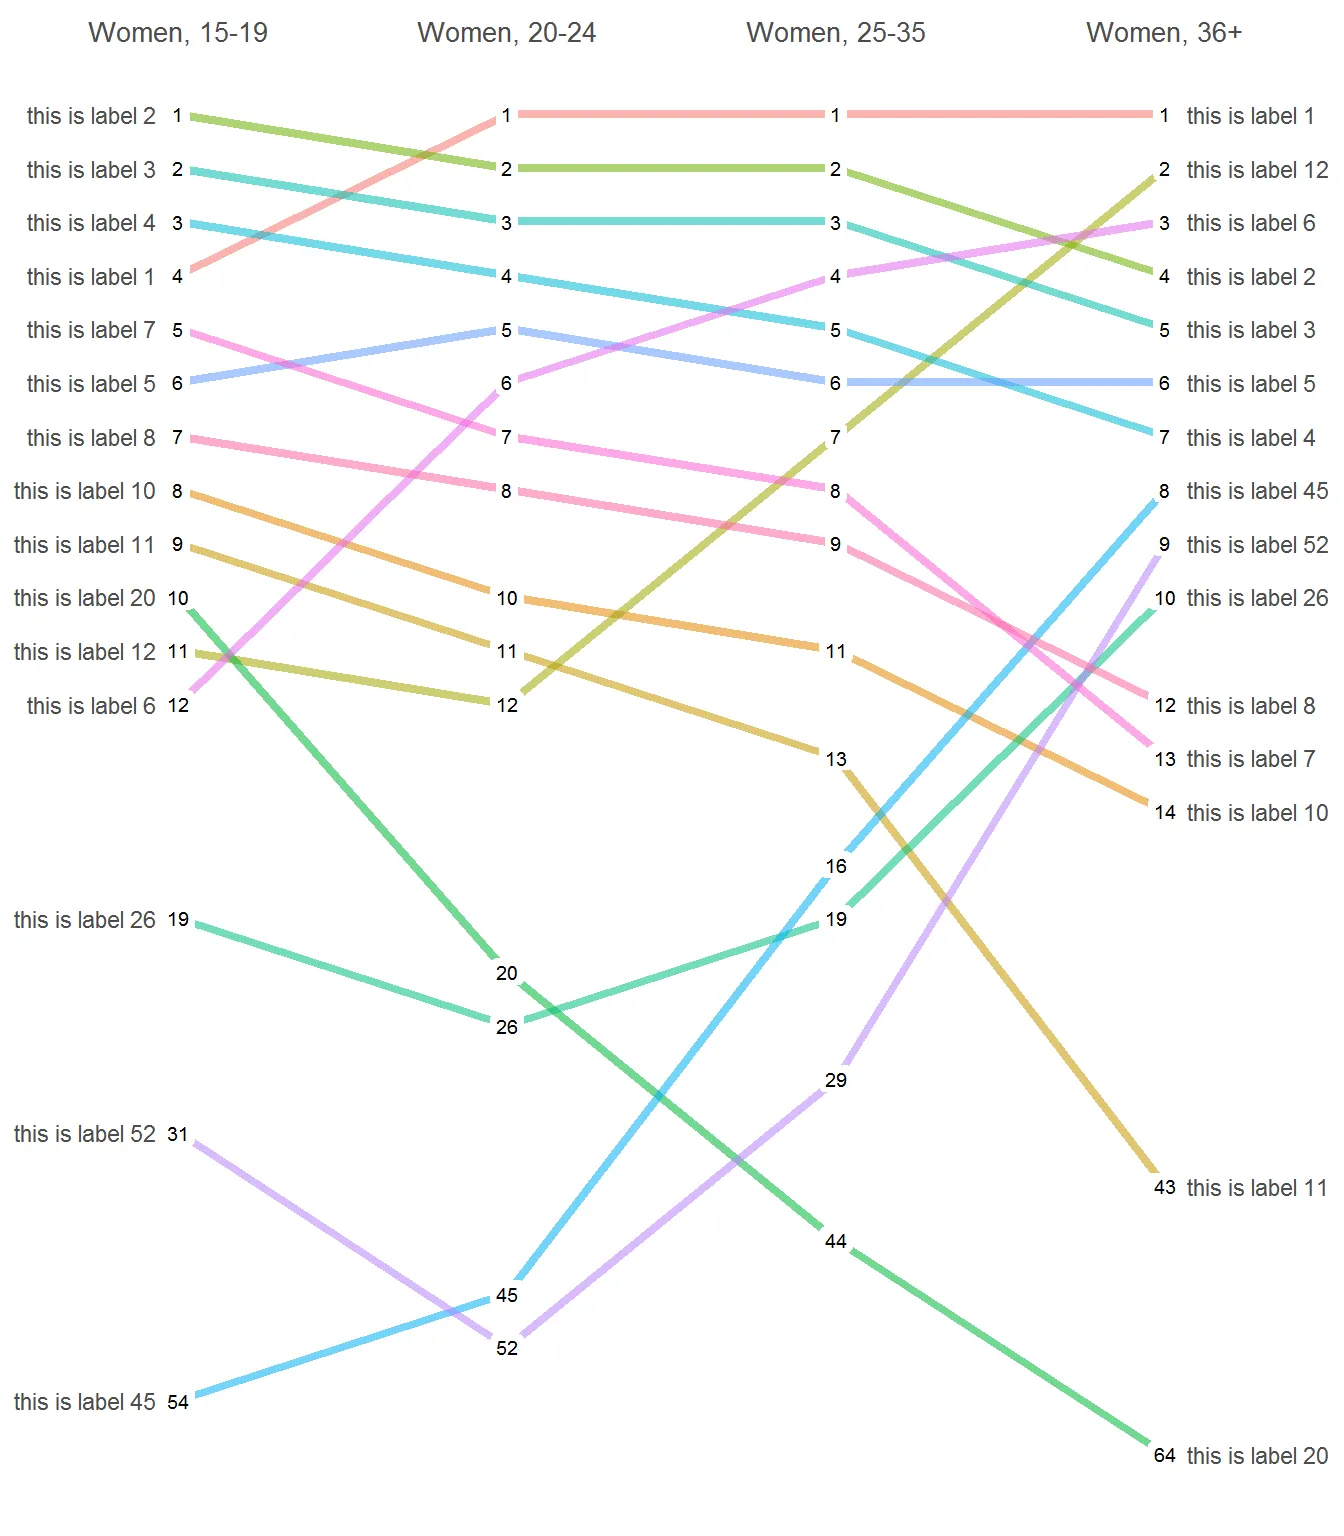
plot.margin = margin(0, 0, 0, 0)添加到theme()中只是在你的示例中挤压了标签。这样做是否有帮助? - aosmithscale_x_discrete()中expand的默认值。这将在x方向上“扩展”图形的边缘/缩小图形的中心,为标签留出更多空间。例如,可以使用expand = expand_scale(add = .7)。 - aosmith