我尝试让Matplotlib图表覆盖笔记本中可用的所有空间。
因此,我希望该图表利用由红色框框起来的空间:
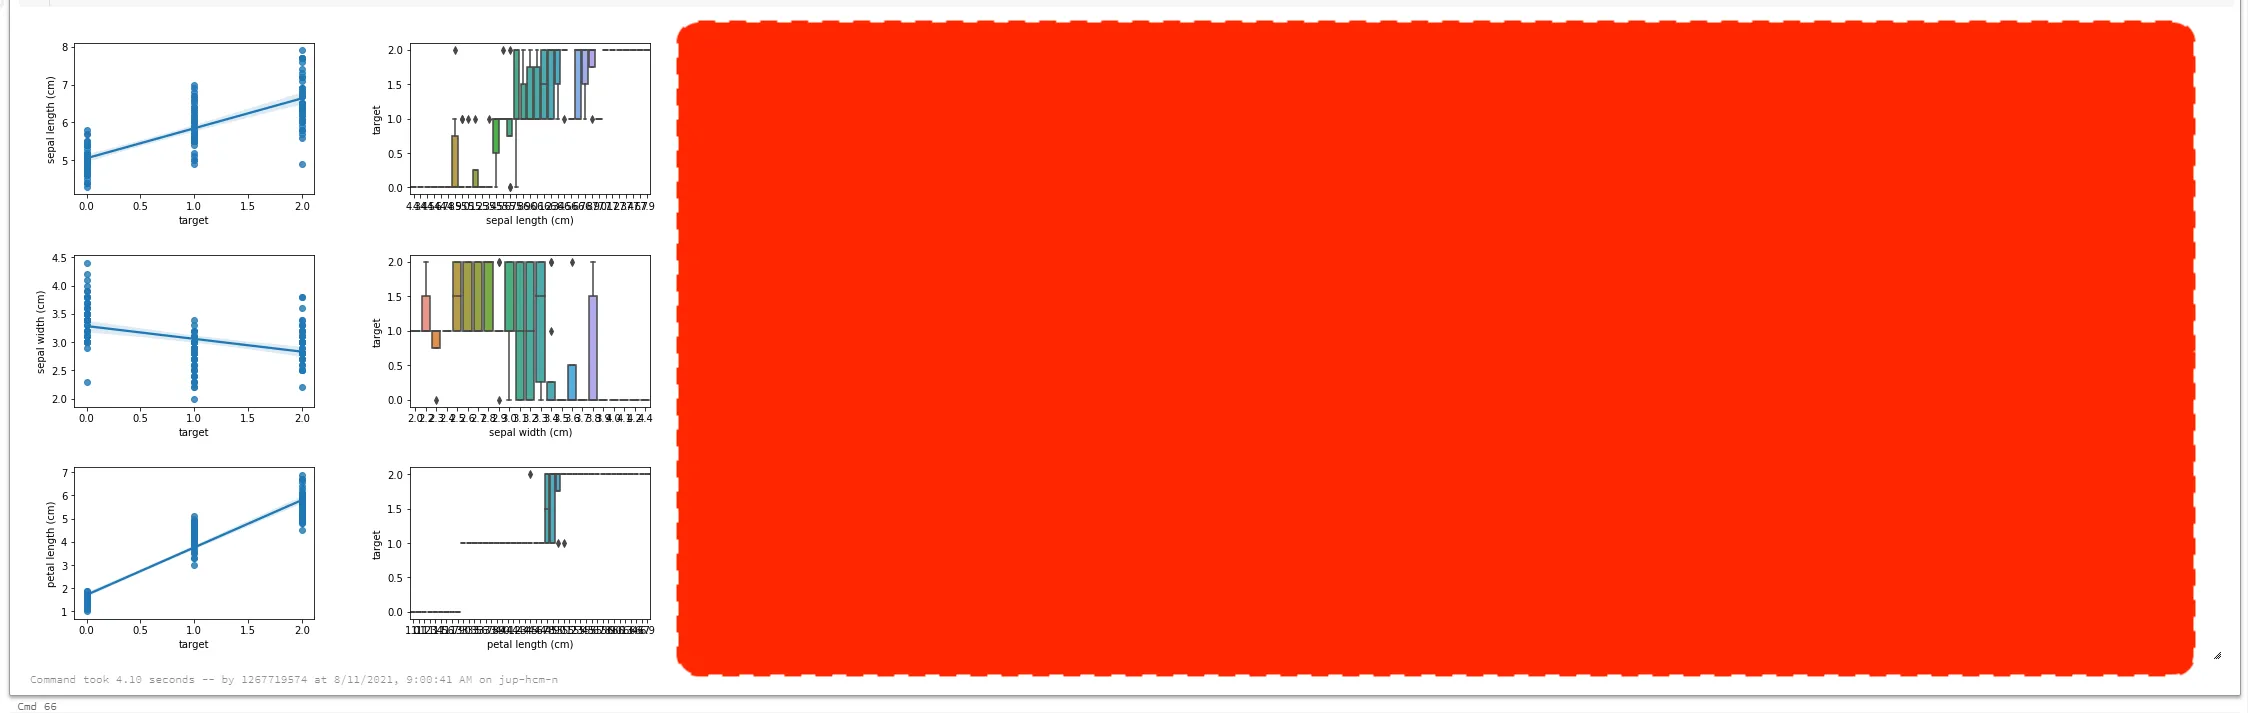
该代码生成了屏幕截图:
from sklearn.datasets import load_iris
import numpy as np
import pandas as pd

iris_data = load_iris()
join_pd_df = pd.DataFrame(
  data = np.c_[
    iris_data['data'],
    iris_data['target'],
  ],
  columns = iris_data['feature_names'] + ['target']
)

import matplotlib.pyplot as plt
import seaborn as sns

list_of_features = [
  "sepal length (cm)",
  "sepal width (cm)",
  "petal length (cm)",
]

number_of_charts = 2
number_of_features = len(list_of_features)
arbitrarily_large_number_of_inches = 10 # I want to avoid hard-coding this value
fig, axes = plt.subplots(
  number_of_features,
  number_of_charts,
  figsize=(arbitrarily_large_number_of_inches, arbitrarily_large_number_of_inches)
)

for iteration, feature in enumerate(list_of_features):
  sns.regplot(x="target", y=feature, data=join_pd_df, ax=axes[iteration, 0])
  sns.boxplot(x=feature, y="target", data=join_pd_df, ax=axes[iteration, 1])

plt.subplots_adjust(
  left = 0.1,
  right = 0.9,
  top = 0.9,
  bottom = 0.1,
  wspace = .4,
  hspace = .4,
)
然而,我希望避免硬编码arbitrarily_large_number_of_inches为10,因为这可能会根据我的显示器屏幕大小而更改。
是否有类似于HTML的width=100%的等效物?类似于subplots_adjust的相对单位也可以。
感谢您的时间。
jupyter-notebook中实现此操作也很感兴趣。这些笔记本中的大多数示例代码已经适用于databrick笔记本。 - Zhao Li