Matplotlib - 强制3D图使用可用的figsize

3

我想创建一个指定大小的图形,并使3D轴尽可能地利用所有可用空间,同时保持所有轴上的等比例。

我的当前尝试显示了一个剪切矩形,隐藏了部分网格。

from mpl_toolkits.mplot3d import Axes3D
import matplotlib.pyplot as plt
import numpy as np

fig = plt.figure(figsize=(5, 2.5))
ax = fig.add_subplot(projection='3d')
ax.get_proj = lambda: np.dot(Axes3D.get_proj(ax), np.diag([1, 1, 1, 0.5]))

u = v = np.linspace(0, 2 * np.pi, 50)
u, v = np.meshgrid(u, v)
X = np.cos(v) * (6 - (5/4 + np.sin(3 * u)) * np.sin(u - 3 * v))
Y = (6 - (5/4 + np.sin(3 * u)) * np.sin(u - 3 * v)) * np.sin(v)
Z = -np.cos(u - 3 * v) * (5/4 + np.sin(3 * u))

ax.plot_surface(X, Y, Z, rstride=1, cstride=1, color=[0.7] * 3, linewidth=0.25, edgecolor="k")
ax.set_box_aspect([ub - lb for lb, ub in (getattr(ax, f'get_{a}lim')() for a in 'xyz')])

plt.show()

当前绘图

我该怎么做?

1个回答

2
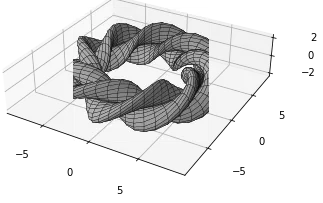
我复制了您提供的代码,只是在最后面添加了4行代码。
from mpl_toolkits.mplot3d import Axes3D
import matplotlib.pyplot as plt
import numpy as np
plt.close()
fig = plt.figure(figsize=(5, 2.5))
ax = fig.add_subplot(projection='3d')
ax.get_proj = lambda: np.dot(Axes3D.get_proj(ax), np.diag([1, 1, 1, 0.5]))

u = v = np.linspace(0, 2 * np.pi, 50)
u, v = np.meshgrid(u, v)
X = np.cos(v) * (6 - (5/4 + np.sin(3 * u)) * np.sin(u - 3 * v))
Y = (6 - (5/4 + np.sin(3 * u)) * np.sin(u - 3 * v)) * np.sin(v)
Z = -np.cos(u - 3 * v) * (5/4 + np.sin(3 * u))

ax.plot_surface(X, Y, Z, rstride=1, cstride=1, color=[0.7] * 3, linewidth=0.25, edgecolor="k")
# ax.set_box_aspect([ub - lb for lb, ub in (getattr(ax, f'get_{a}lim')() for a in 'xyz')])


left, right = plt.xlim()
ax.set_zlim(left, right)
ax.set_ylim(left, right)
plt.tight_layout()

我注释掉了ax.set_box_aspect这行代码,因为它会报错。以上的输出结果是:

enter image description here

--- 编辑 ---
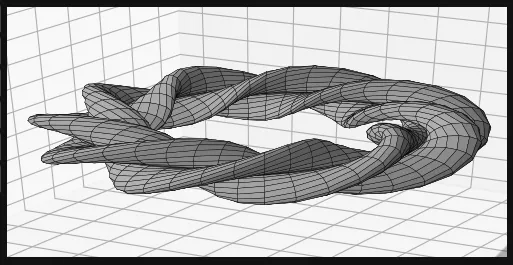
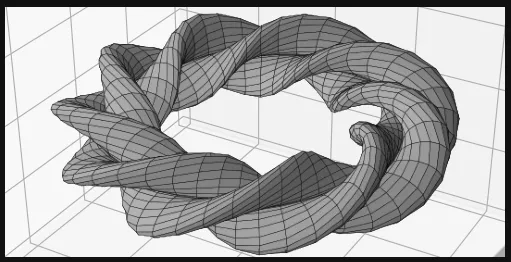
我有一个解决办法可以让它在matplotlib v3.4.2中正常工作:
from mpl_toolkits.mplot3d import Axes3D
import matplotlib.pyplot as plt
import numpy as np
import os

plt.close()

# your code starts here, with a little modification
fig = plt.figure(figsize=(5,5))
ax = fig.add_subplot(projection='3d')

u = v = np.linspace(0, 2 * np.pi, 50)
u, v = np.meshgrid(u, v)
X = np.cos(v) * (6 - (5/4 + np.sin(3 * u)) * np.sin(u - 3 * v))
Y = (6 - (5/4 + np.sin(3 * u)) * np.sin(u - 3 * v)) * np.sin(v)
Z = -np.cos(u - 3 * v) * (5/4 + np.sin(3 * u))
ax.plot_surface(X, Y, Z, rstride=1, cstride=1, color=[0.7] * 3, linewidth=0.25, edgecolor="k")

# set the axes limits
left, right = plt.xlim()
ax.set_zlim(left, right)
ax.set_ylim(left, right)

# zoom in to the plot
ax.dist = 6

# make everything other than the plot itself transparent
fig.patch.set_alpha(0)
ax.patch.set_alpha(0)
ax.axis('off')
plt.tight_layout()

# save plot as image
plt.savefig('plotted.png')

# remove the axes where the image was plotted
ax.remove()

# resize figsize
fig = matplotlib.pyplot.gcf()
fig.set_size_inches(5, 2.5)

# add fake axes for gridlines as in 3d plot to make it look like a real plot
# skip this part if the gridlines are unnecessary
ax_bg = fig.add_subplot(111, projection='3d')
ax_bg.dist = 3

# add axes in cartesian coordinates (xy-plane) for the image
ax = fig.add_subplot(111)
fig.patch.set_alpha(1)
fig.subplots_adjust(left=0, bottom=0, right=1, top=1, wspace=0, hspace=0)
im = plt.imread('plotted.png')

h, w, dc = im.shape # (height=500, width=500, depth/color=4)
im_cropped = im[120:390, :, :] # this is manually adjusted
ax.axis('off')
ax.imshow(im_cropped)

# delete the saved image
os.remove('plotted.png')

输出结果为:

enter image description here

我不知道它是否适用于您的特定情况,但它可以满足您的问题。

如果有不清楚的地方,请让我知道。


你使用的是哪个matplotlib版本?我尝试了v3.4.2和v3.4.1:它们都显示了那个可怕的剪切矩形,即使使用了你的代码。 - Davide_sd
1
我使用的是3.2.1版本。你说得对,我刚刚更新了我的matplotlib,现在看起来很糟糕...如果我能解决它,我会告诉你的。 - Karina
2
也许有点晚了,但我更新了我的答案,并且它适用于v3.4.2。 - Karina
1
我接受了这个答案,虽然有点过度杀伐 :) 很棒的努力!!! 相反,我选择了最简单的路线:创建了一个新环境并安装了matplotlib v3.1.2。效果非常好。原来问题的行为是较新版本的一个错误:https://github.com/matplotlib/matplotlib/issues/20904 - Davide_sd
1
是的,我必须承认这有些过度了,但它确实有效 ;) 我从未想到可以创建一个新环境。完全错过了那个选项...哈哈。这肯定更容易了。 - Karina

网页内容由stack overflow 提供, 点击上面的
可以查看英文原文,
原文链接