调整Matplotlib 3D图的颜色范围

4

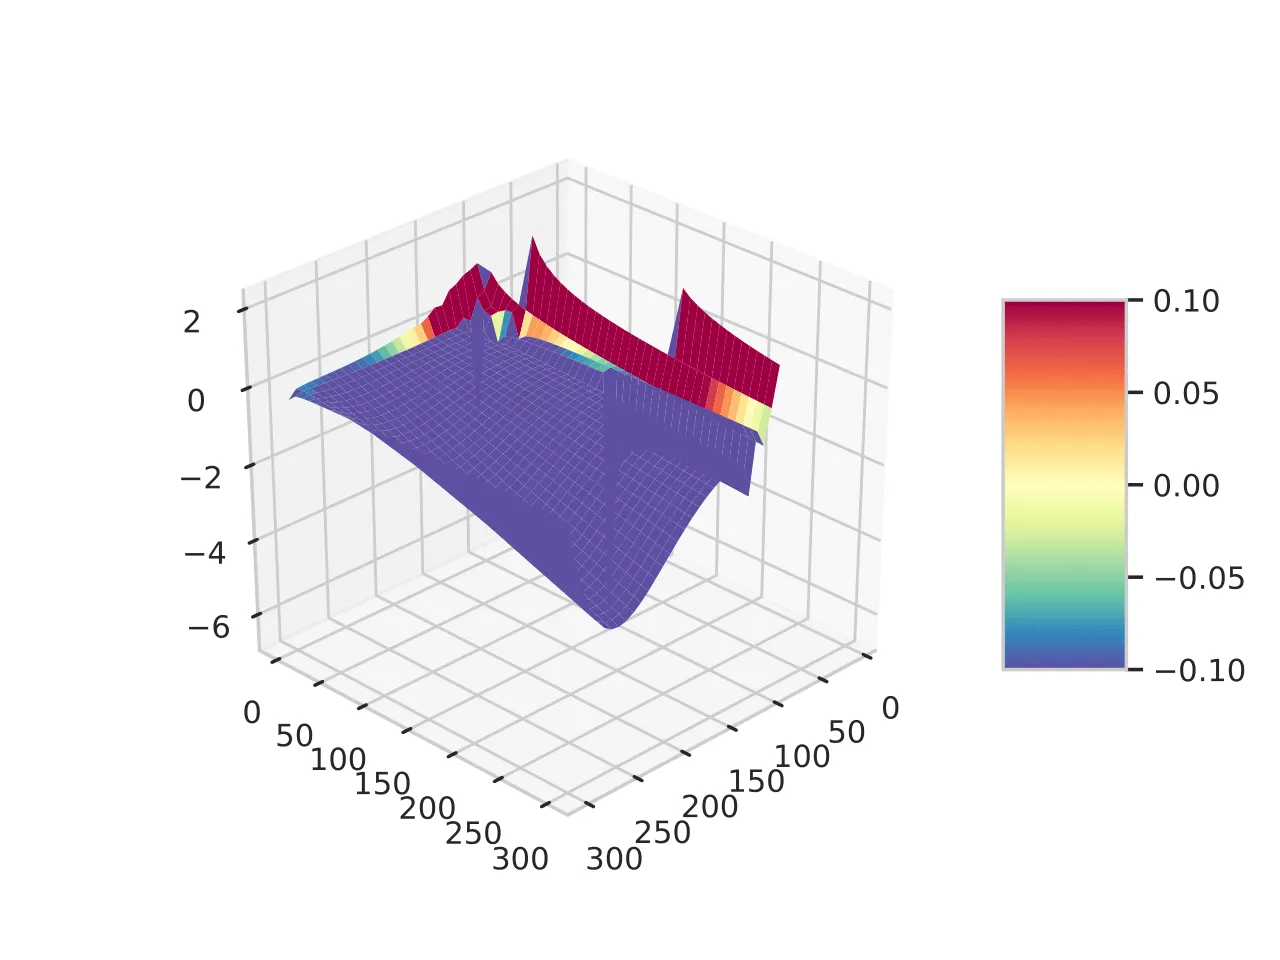
我正在尝试制作一个3D图,但颜色范围非常小,只覆盖了Z轴可能具有的很小一部分值。如何解决这个问题?

我附上代码和我得到的图片:

fig = plt.figure()
ax = fig.gca(projection='3d')
surf = ax.plot_surface(B , ENERGY, result_plot, cmap=cm.Spectral_r , linewidth=0.0 ,antialiased =False)

colorbar( surf, shrink=0.5, aspect=3)


ax.view_init(30, 45)
plt.show()

3d plot

1个回答

8

在未来请提供一个最小和可验证的示例。颜色限制是基于您的数据确定的。因此,我不完全确定您的数据是否支持比它所显示的更多的值。使用文档中的示例,我们可以使用vminvmax强制限制。

enter image description here

# This import registers the 3D projection, but is otherwise unused.
from mpl_toolkits.mplot3d import Axes3D  # noqa: F401 unused import

import matplotlib.pyplot as plt
from matplotlib import cm
from matplotlib.ticker import LinearLocator, FormatStrFormatter
import numpy as np


fig = plt.figure()
ax = fig.gca(projection='3d')

# Make data.
X = np.arange(-5, 5, 0.25)
Y = np.arange(-5, 5, 0.25)
X, Y = np.meshgrid(X, Y)
R = np.sqrt(X**2 + Y**2)
Z = np.sin(R)

# Plot the surface.
surf = ax.plot_surface(X, Y, Z, cmap=cm.coolwarm,
                       linewidth=0, antialiased=False, vmin = -10, vmax = 10)

# Customize the z axis.
ax.set_zlim(-1.01, 1.01)
ax.zaxis.set_major_locator(LinearLocator(10))
ax.zaxis.set_major_formatter(FormatStrFormatter('%.02f'))

# Add a color bar which maps values to colors.
fig.colorbar(surf, shrink=0.5, aspect=5)

plt.show()

网页内容由stack overflow 提供, 点击上面的
可以查看英文原文,
原文链接