我使用以下代码在matplotlib中绘制了一个3D图形:
#Previously defines lists of data to plot...
fig = plt.figure()
ax = fig.add_subplot(111,projection='3d')

ax.set_axis_bgcolor('black')
ax.xaxis.label.set_color('white')
ax.yaxis.label.set_color('white')
ax.zaxis.label.set_color('white')
ax.tick_params(axis='x',colors='white')
ax.tick_params(axis='y',colors='white')
ax.tick_params(axis='z',colors='white')

ax.scatter(swasp_mag1,swasp_per1,swasp_age1,edgecolor='none',c='r',marker='o',s=35,label='SWASP')
ax.scatter(hyd_mag1,hyd_per1,hyd_age1,edgecolor='none',c='y',marker='o',s=35,label='Hyades')
ax.scatter(pld_mag1,pld_per1,pld_age1,edgecolor='none',c='b',marker='o',s=35,label='Pleiades')

ax.set_xlabel('B-V [mag]')
ax.set_ylabel('Period [days]')
ax.set_zlabel('Age [Myr]')

ax.set_xlim(0.495,1.6)
ax.set_ylim(0,30)
ax.set_zlim(0,600)

ax.legend(scatterpoints=1)
plt.show()
当我运行这个程序时,我得到了以下结果:
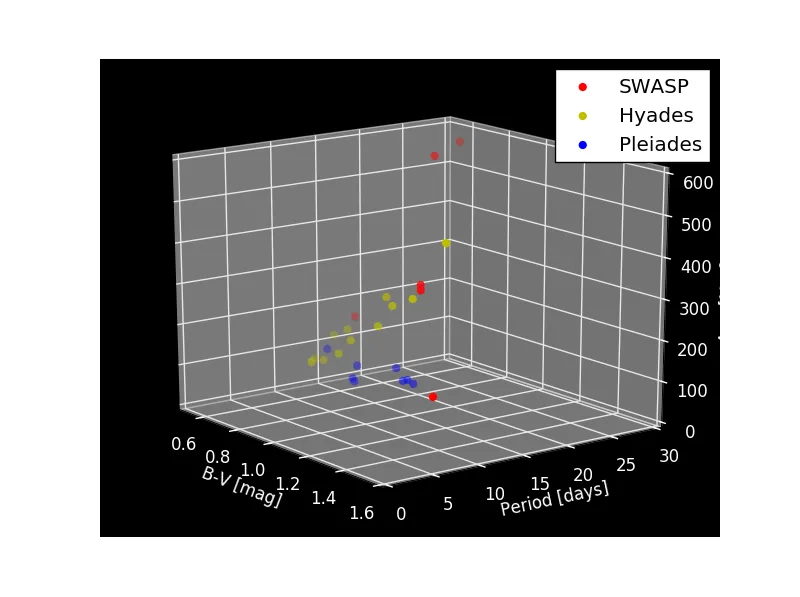 我已经将背景改为黑色,脊柱改为白色(如图所示),但我想改变平面的颜色(即图像中的灰色区域)。我已经进行了研究,但没有找到改变3D matplotlib图形中平面颜色的方法。有没有办法可以改变平面的颜色?