设置matplotlib 3D图的刻度颜色

5
如果我有一个3D matplotlib图 (
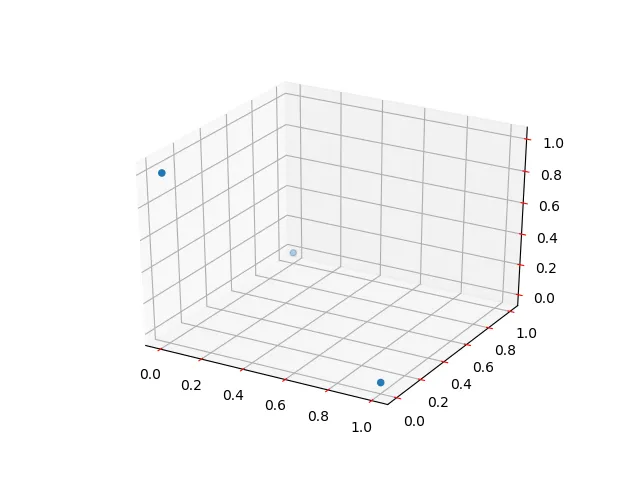
Axes3D 对象),怎么更改刻度线的颜色?我已经找到了如何更改轴线、刻度标签和轴标签的颜色。很明显,使用 ax.tick_params(axis='x', colors='red') 只会改变刻度标签而不是刻度线本身。以下是试图将所有轴都更改为红色并获取除了刻度线之外所有内容的代码:
from mpl_toolkits.mplot3d import Axes3D
from matplotlib import pyplot as plt

fig = plt.figure()
ax = Axes3D(fig)

ax.scatter((0, 0, 1), (0, 1, 0), (1, 0, 0))
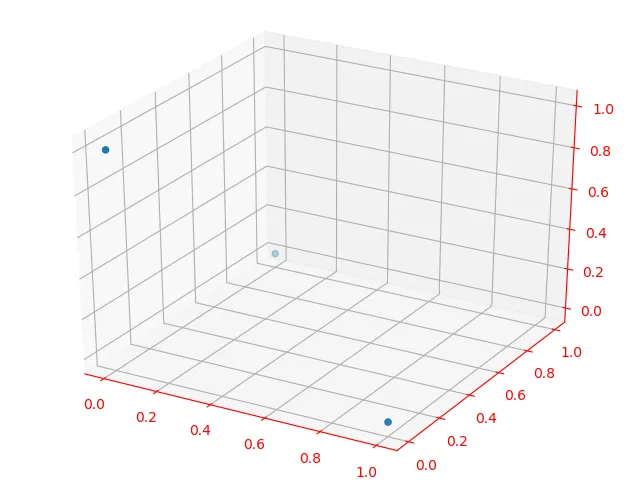
ax.w_xaxis.line.set_color('red')
ax.w_yaxis.line.set_color('red')
ax.w_zaxis.line.set_color('red')
ax.xaxis.label.set_color('red')
ax.yaxis.label.set_color('red')
ax.zaxis.label.set_color('red')
ax.tick_params(axis='x', colors='red')  # only affects
ax.tick_params(axis='y', colors='red')  # tick labels
ax.tick_params(axis='z', colors='red')  # not tick marks

fig.show()

enter image description here


代码对我有效(所有勾选颜色都是红色)。我的matplotlib版本是1.3.1。 - Banghua Zhao
@Banghua 我在matplotlib 2.0.0和3.0.2中运行了这个程序,结果相同。可能是很久以前就出现了问题。 - drhagen
2个回答

7

手册页面中提到的,关于 tick_params(axis='both', **kwargs) 函数,您会遇到一个错误:

尽管目前已实现该函数,但 Axes3D 对象的核心部分可能会忽略其中的一些设置。未来的版本将修复此问题。我们将优先考虑那些报告 Bug 的用户。

为了解决这个问题,请使用内部的_axinfo字典,例如这个示例中的方法:

from mpl_toolkits.mplot3d import Axes3D
from matplotlib import pyplot as plt

fig = plt.figure()
ax = fig.gca(projection='3d')

ax.scatter((0, 0, 1), (0, 1, 0), (1, 0, 0))

ax.xaxis._axinfo['tick']['color']='r'
ax.yaxis._axinfo['tick']['color']='r'
ax.zaxis._axinfo['tick']['color']='r'
plt.show()

enter image description here


2
以下是实现预期结果的简单方法:

一种直接的方法是按照以下步骤进行:

from mpl_toolkits.mplot3d import Axes3D
from matplotlib import rcParams
from matplotlib import pyplot as plt

rcParams['xtick.color'] = 'red'
rcParams['ytick.color'] = 'red'
rcParams['axes.labelcolor'] = 'red'
rcParams['axes.edgecolor'] = 'red'

fig = plt.figure()
ax = Axes3D(fig)

ax.scatter((0, 0, 1), (0, 1, 0), (1, 0, 0))
plt.show()

输出显示为:

这里输入图片描述


此代码不允许单独更改Z轴的颜色。 - Serenity

网页内容由stack overflow 提供, 点击上面的
可以查看英文原文,
原文链接