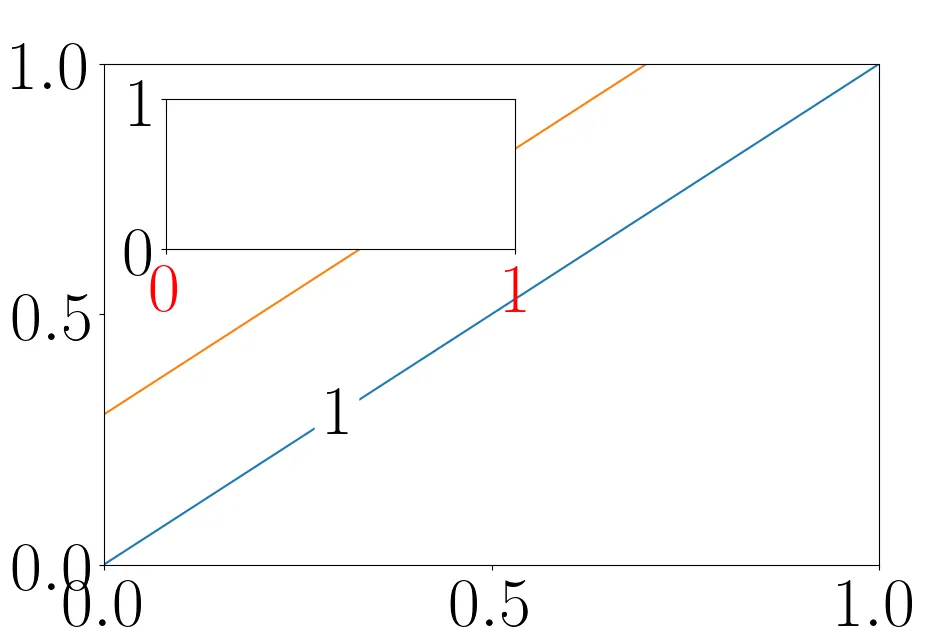
我的子图的刻度标签与数据重叠了。我想将x轴刻度标签设置为有背景颜色(例如白色)。目前我只能找到如何更改标签的颜色,但无法更改背景。我知道如何使用文本对象来实现此效果,如下所示。(注意 - 我不想让整个子图的边距被着色,而只是刻度标签)。
最小工作示例
import matplotlib as mpl

rc_fonts = {
    "text.usetex": True,
    'text.latex.preview': True,
    "font.size": 50,
    'mathtext.default': 'regular',
    'axes.titlesize': 55,
    "axes.labelsize": 55,
    "legend.fontsize": 50,
    "xtick.labelsize": 50,
    "ytick.labelsize": 50,
    'figure.titlesize': 55,
    'figure.figsize': (10, 6.5),  # 15, 9.3
    'text.latex.preamble': [
        r"""\usepackage{lmodern,amsmath,amssymb,bm,physics,mathtools,nicefrac,letltxmacro,fixcmex}
        """],
    "font.family": "serif",
    "font.serif": "computer modern roman",
}
mpl.rcParams.update(rc_fonts)
import matplotlib.pylab as plt
from mpl_toolkits.axes_grid1.inset_locator import inset_axes, InsetPosition, mark_inset
from numpy import linspace, sin


x = linspace(0, 1, 100)
plt.clf()
ax1 = plt.gca()
ax2 = plt.axes([0, 0, 1, 1], label=str(2))
ip = InsetPosition(ax1, [0.08, 0.63, 0.45, 0.3])
ax2.set_axes_locator(ip)
ax1.plot(x, x)
ax1.plot(x, x + 0.3)
ax1.set_xlim(0, 1)
ax1.set_ylim(0, 1)
ax2.xaxis.set_tick_params(labelcolor='r')
ax1.text(0.3, 0.3, '$1$', transform=ax1.transAxes, horizontalalignment='center', verticalalignment='center', color='black', backgroundcolor='white')
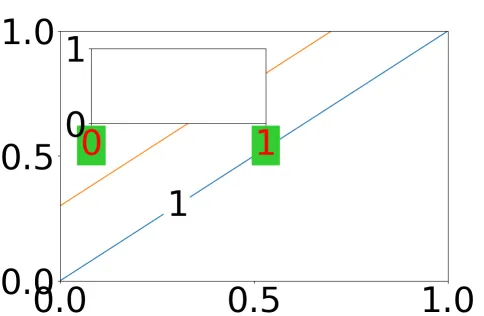

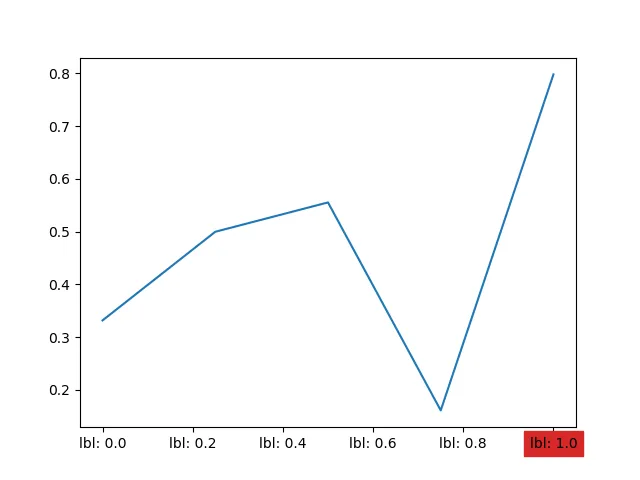
backgroundalpha,但是你可以使用bbox参数,就像更新后的答案中一样。 - ImportanceOfBeingErnestplt.setp(ax2.get_xticklabels(), backgroundcolor="#32cd327f"),以添加0.5的alpha。或者只需使用bbox参数。 - qRTPCRbbox参数添加alpha值。我只是想强调一种替代方案,如果你只关心带有alpha的背景颜色。当然,你的回答没有问题。 - qRTPCR