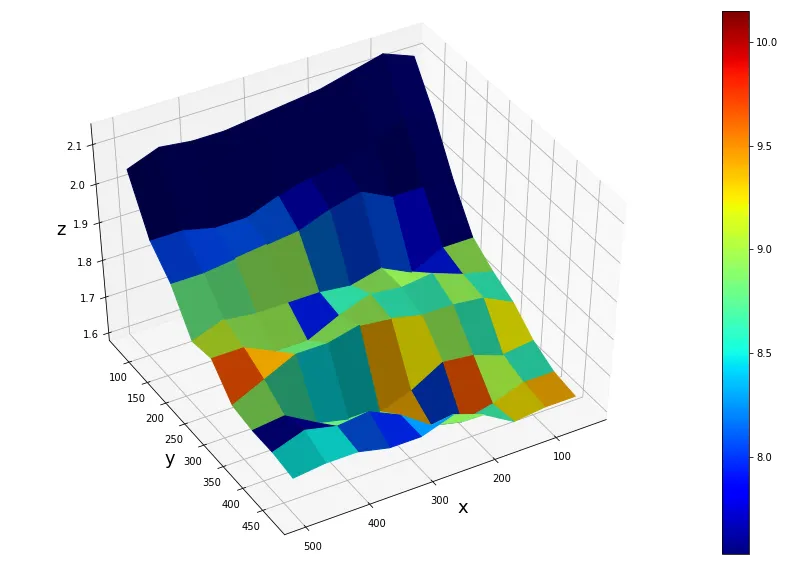
我正在尝试使用 facecolors 在三维图中预定义颜色来对表面进行着色。这里的问题是 cm.ScalarMappable 规范化表面颜色的V,而 plt.cm.jet 不进行规范化,因此出现了颜色和颜色条的不匹配。我已经手动尝试规范化了V(即V_normalized),但结果仍然不完全正确。实际上,V 的最高值应该在表面的一个角落,但实际上图片中并没有反映出来。如何确保表面的颜色正确无误地显示?
import numpy as np
import pandas as pd
import matplotlib.pyplot as plt
from mpl_toolkits.mplot3d import Axes3D
from matplotlib import cm
# Create data.
X = np.array([[ 50, 100, 150, 200, 250, 300, 350, 400, 450, 500],
              [ 50, 100, 150, 200, 250, 300, 350, 400, 450, 500],
              [ 50, 100, 150, 200, 250, 300, 350, 400, 450, 500],
              [ 50, 100, 150, 200, 250, 300, 350, 400, 450, 500],
              [ 50, 100, 150, 200, 250, 300, 350, 400, 450, 500],
              [ 50, 100, 150, 200, 250, 300, 350, 400, 450, 500],
              [ 50, 100, 150, 200, 250, 300, 350, 400, 450, 500],
              [ 50, 100, 150, 200, 250, 300, 350, 400, 450, 500],
              [ 50, 100, 150, 200, 250, 300, 350, 400, 450, 500]])
Y = np.array([[ 75,  75,  75,  75,  75,  75,  75,  75,  75,  75],
               [125, 125, 125, 125, 125, 125, 125, 125, 125, 125],
               [175, 175, 175, 175, 175, 175, 175, 175, 175, 175],
               [225, 225, 225, 225, 225, 225, 225, 225, 225, 225],
               [275, 275, 275, 275, 275, 275, 275, 275, 275, 275],
               [325, 325, 325, 325, 325, 325, 325, 325, 325, 325],
               [375, 375, 375, 375, 375, 375, 375, 375, 375, 375],
               [425, 425, 425, 425, 425, 425, 425, 425, 425, 425],
               [475, 475, 475, 475, 475, 475, 475, 475, 475, 475]])
Z = pd.DataFrame([[2.11, 2.14, 2.12, 2.10, 2.09, 2.08, 2.07, 2.07, 2.08, 2.05],
                   [2.01, 2.03, 1.99, 1.96, 1.95, 1.93, 1.90, 1.90, 1.92, 1.92],
                   [1.89, 1.90, 1.90, 1.94, 1.92, 1.89, 1.88, 1.87, 1.86, 1.86],
                   [1.79, 1.79, 1.75, 1.79, 1.77, 1.78, 1.78, 1.78, 1.79, 1.76],
                   [1.75, 1.77, 1.8, 1.79, 1.8, 1.77, 1.73, 1.73, 1.77, 1.77],
                   [1.72, 1.76, 1.77, 1.77, 1.79, 1.8, 1.78, 1.78, 1.74, 1.7],
                   [1.67, 1.66, 1.69, 1.7, 1.65, 1.62, 1.63, 1.65, 1.7, 1.69],
                   [1.64, 1.64, 1.61, 1.59, 1.61, 1.67, 1.71, 1.7, 1.72, 1.69],
                   [1.63, 1.63, 1.62, 1.67, 1.7, 1.67, 1.67, 1.69, 1.69, 1.68]],
                 index=np.arange(75, 525, 50), columns=np.arange(50, 525, 50))
V = pd.DataFrame([[  7.53,   7.53,   7.53,   7.53,   7.53,   7.53,   7.53,   7.53, 7.53,   7.53],
       [  7.53,   7.53,   7.53,   7.53,   7.66,   8.09,   8.08,   8.05, 8.05,   8.05],
       [  7.53,   7.77,   8.08,   8.05,   8.19,   8.95,   8.93,   8.79,8.79,   8.62],
       [  8.95,   7.92,   8.95,   8.93,   8.62,   7.93,   8.96,   8.95, 9.09,   8.75],
       [  8.61,   8.95,   8.62,   8.61,   8.95,   8.93,   8.82,   9.42, 9.67,   8.48],
       [  9.23,   8.61,   8.95,   9.24,   9.42,   8.48,   8.47,   8.65, 8.92,   9.17],
       [  8.6 ,   9.01,   9.66,   8.05,   9.42,   8.92,   8.81,   7.53, 7.53,   7.53],
       [  9.42,   9.25,   8.65,   8.92,   8.25,   7.97,   8.09,   8.49, 8.49,   7.58],
       [ 10.15,   9.79,   9.1 ,   9.35,   9.35,   9.35,   9.25,   9.3 , 9.3 ,   8.19]],
                index=np.arange(75, 525, 50), columns=np.arange(50, 525, 50))
# Create the figure, add a 3d axis, set the viewing angle
# % matplotlib inline  # If you are using IPython
fig = plt.figure(figsize=[15,10])
ax = fig.add_subplot(111, projection='3d')
ax.view_init(45,60)
# Normalize in [0, 1] the DataFrame V that defines the color of the surface.
V_normalized = (V - V.min().min())
V_normalized = V_normalized / V_normalized.max().max()
# Plot
ax.plot_surface(X, Y, Z, facecolors=plt.cm.jet(V_normalized))
ax.set_xlabel('x', fontsize=18)
ax.set_ylabel('y', fontsize=18)
ax.set_zlabel('z', fontsize=18)
m = cm.ScalarMappable(cmap=cm.jet)
m.set_array(V)
plt.colorbar(m)