Matplotlib:如何更改双柱图的 figsize

12

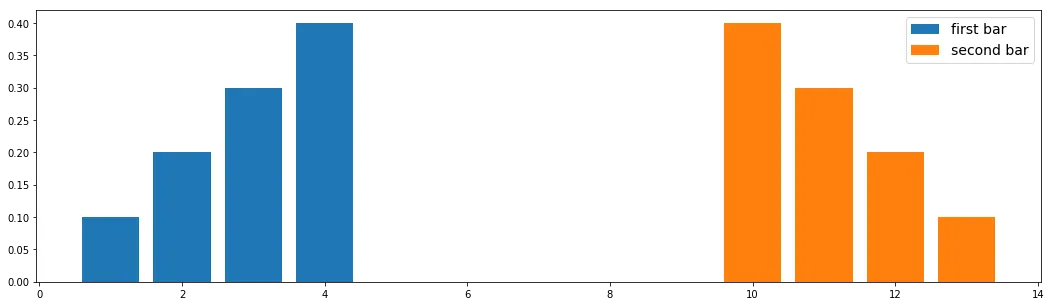
我使用以下代码在matplotlib中绘制了一个双栏条形图:

x = pd.Series(range(12))
y = self.cust_data['Cluster_ID'].value_counts().sort_index()
z = self.cust_data['Cluster_ID_NEW'].value_counts().sort_index()
plt.bar(x + 0.0, y, color = 'b', width = 0.5)
plt.bar(x + 0.5, z, color = 'g', width = 0.5)
plt.legend(['Old Cluster', 'New Cluster'])
plt.savefig("C:\\Users\\utkarsh.a.ranjan\\Documents\\pyqt_data\\generate_results\\bar", bbox_inches='tight',pad_inches=0.1)
plt.clf()

我想使用figsize参数使得生成的图更大,当只需要绘制一个柱状图时这很容易,但是在这里,我不确定应该把figsize参数放在哪里。


如果您提供了数据示例,那么您的问题就可以被复现。请参考以下链接:https://stackoverflow.com/help/mcve - nahusznaj
3个回答

18

你可以使用figsize设置尺寸。

import matplotlib.pyplot as plt

f, ax = plt.subplots(figsize=(18,5)) # set the size that you'd like (width, height)
plt.bar([1,2,3,4], [0.1,0.2,0.3,0.4], label = 'first bar')
plt.bar([10,11,12,13], [0.4,0.3,0.2,0.1], label = 'second bar')
ax.legend(fontsize = 14)

这里输入图片描述


8
最好的方法是采用更面向对象的方式来实现:

fig, ax = plt.subplots(figsize=(12,12))
ax.bar(x + 0.0, y, color = 'b', width = 0.5)
ax.bar(x + 0.5, z, color = 'g', width = 0.5)
ax.legend(['Old Cluster', 'New Cluster'])
fig.savefig("C:\\Users\\utkarsh.a.ranjan\\Documents\\pyqt_data\\generate_results\\bar", bbox_inches='tight',pad_inches=0.1)
plt.clf()

你可能还希望在文件名中添加格式。如果不添加,格式将从你的rc参数savefig.format获取,默认为png
此外,如果你想尽可能保留你的代码,你也可以在plt.bar(...)之前添加以下一行代码:
plt.figure(figsize=(12,12))

3
非常简单的增加绘图大小的方法是在你的代码之前添加这行代码:

plt.rcParams["figure.figsize"] = (10, 5)

您可以根据您的意愿更改图形大小。

网页内容由stack overflow 提供, 点击上面的
可以查看英文原文,
原文链接