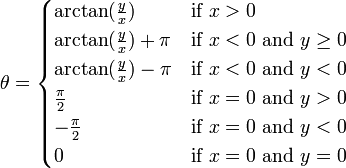
Mathematica有一个专门用于此目的的绘图函数:ListPolarPlot。您需要将您的x,y对转换为theta,r对,例如如下:
ListPolarPlot[{ArcTan[
PolarAxes -> True,
PolarGridLines -> Automatic,
Joined -> False,
PolarTicks -> {"Degrees", Automatic},
BaseStyle -> {FontFamily -> "Arial", FontWeight -> Bold,FontSize -> 12},
PlotStyle -> {Red, PointSize -> 0.02}
]
更新
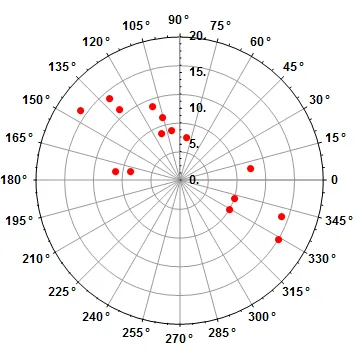
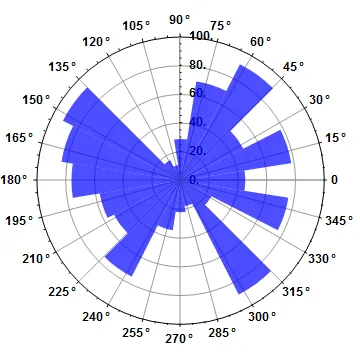
根据评论的要求,可以按照以下方式制作极地直方图:
maxScale = 100
angleDivisions = 20
dAng = (2 \[Pi])/angleDivisions
一些测试数据:
(counts = Table[RandomInteger[{0, 100}], {ang, angleDivisions}]) // BarChart
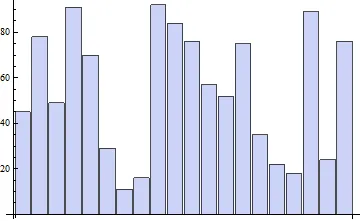
ListPolarPlot[{{0, maxScale}},
    PolarAxes -> True, PolarGridLines -> Automatic,
    PolarTicks -> {"Degrees", Automatic},
    BaseStyle -> {FontFamily -> "Arial", FontWeight -> Bold, FontSize -> 12},
    PlotStyle -> {None},
    Epilog -> {Opacity[0.7], Blue,
               Table[
                 Polygon@
                  {
                   {0, 0},
                   counts[[ang + 1]] {Cos[ang dAng - dAng/2],Sin[ang dAng- dAng/2]},
                   counts[[ang + 1]] {Cos[ang dAng + dAng/2],Sin[ang dAng+ dAng/2]}
                  },
                 {ang, 0, angleDivisions - 1}
               ]}
]
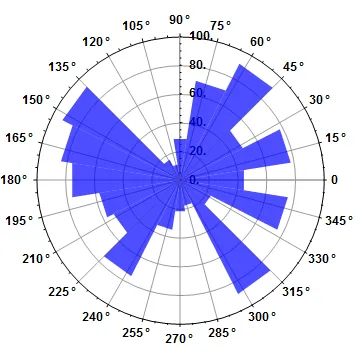
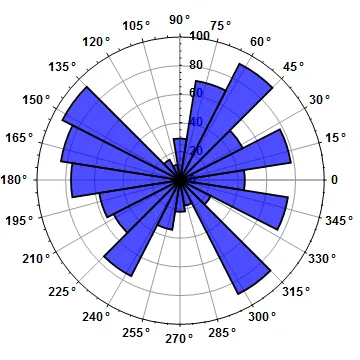
使用磁盘扇区而不是多边形,进行小的视觉改进:
ListPolarPlot[{{0, maxScale}},
    PolarAxes -> True, PolarGridLines -> Automatic,
    PolarTicks -> {"Degrees", Automatic},
    BaseStyle -> {FontFamily -> "Arial", FontWeight -> Bold,
    FontSize -> 12}, PlotStyle -> {None},
    Epilog -> {Opacity[0.7], Blue,
               Table[
                 Disk[{0,0},counts[[ang+1]],{ang dAng-dAng/2,ang dAng+dAng/2}],
                 {ang, 0, angleDivisions - 1}
               ]
              }
]
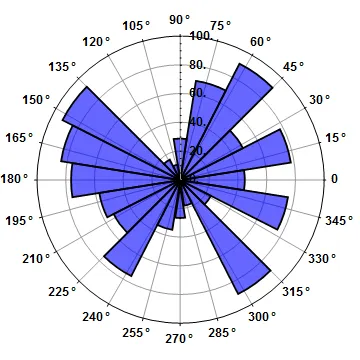
通过在
Epilog中添加
EdgeForm[{Black, Thickness[0.005]}],可以更清晰地分离“条形图”。现在标记环的数字仍然有不必要的小数点。使用替换
/. Style[num_?MachineNumberQ, List[]] -> Style[num // Round, List[]]跟踪绘图可消除这些问题。最终结果如下:
上面的图表也可以使用
SectorChart生成,尽管此图表主要用于显示数据的宽度和高度变化,并且未经过精细调整,不适用于您具有固定宽度部分并且想要突出显示这些方向和数据计数的情况。但是可以通过使用
SectorOrigin来完成。问题是我认为扇形的中点代表其方向,因此要使一个扇形的中点为0度,我必须将原点偏移
\[Pi]/angleDivisions并手动指定刻度,因为它们也会被旋转:
SectorChart[
   {ConstantArray[1, Length[counts]], counts}\[Transpose],
   SectorOrigin -> {-\[Pi]/angleDivisions, "Counterclockwise"},
   PolarAxes -> True, PolarGridLines -> Automatic,
   PolarTicks ->
    {
     Table[{i \[Degree] + \[Pi]/angleDivisions, i \[Degree]}, {i, 0, 345, 15}],
     Automatic
    },
   ChartStyle -> {Directive[EdgeForm[{Black, Thickness[0.005]}], Blue]},
   BaseStyle -> {FontFamily -> "Arial", FontWeight -> Bold,
   FontSize -> 12}
 ]
故事情节几乎相同,但更具互动性(包括工具提示等)。