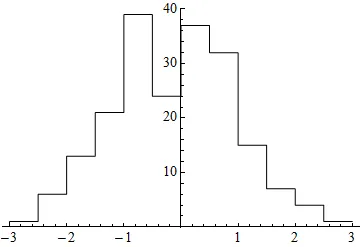
我正在尝试制作一张没有垂直线的直方图。我希望有一个看起来像函数的图表,就像这样:
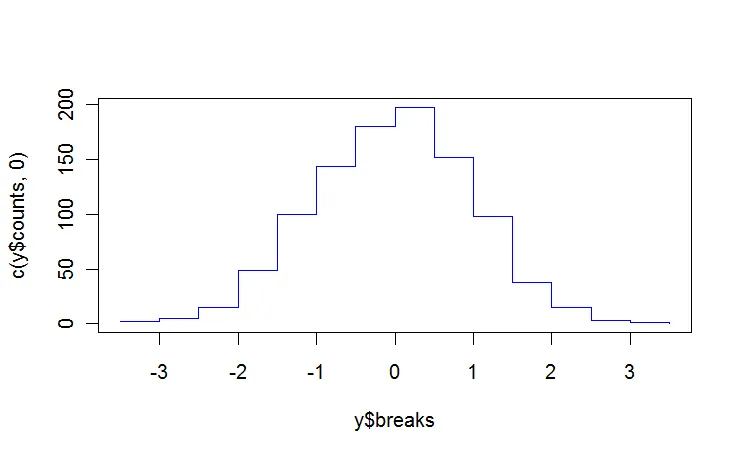
以前在 R 中也有类似的问题(histogram without vertical lines),但我现在用的是 Mathematica。
我一直在研究不带成功的 ChartStyle 选项。
我正在尝试制作一张没有垂直线的直方图。我希望有一个看起来像函数的图表,就像这样:
以前在 R 中也有类似的问题(histogram without vertical lines),但我现在用的是 Mathematica。
我一直在研究不带成功的 ChartStyle 选项。
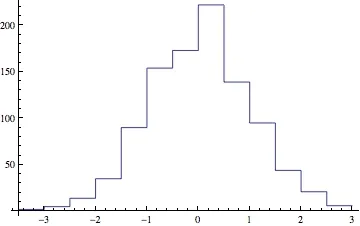
ListPlot和InterpolationOrder->0来实现:(* example data *)
data = RandomVariate[NormalDistribution[], 10^3];
hist = HistogramList[data, {.5}];
ListPlot[Transpose[{hist[[1]], ArrayPad[hist[[2]], {0, 1}, "Fixed"]}],
InterpolationOrder -> 0,
Joined -> True,
AxesOrigin -> {hist[[1, 1]], 0}]
可能有一些方法可以通过在Histogram中操作EdgeForm[]和FaceForm[]来实现,但我发现每次需要时自己制作一个更简单。下面是一个非常简单且快速的示例:
histPlot[data_, bins_, color_: Blue] := Module[{
        countBorder =
    Partition[Riffle[Riffle[#1, #1[[2 ;;]]], Riffle[#2, #2]], 2] & @@
     HistogramList[data, bins, "PDF"]
    },
    ListLinePlot[countBorder, PlotStyle -> color]
    ]
使用 histPlot[RandomReal[NormalDistribution[],{1000}],{-3,3,0.1}] 可以得到下图:
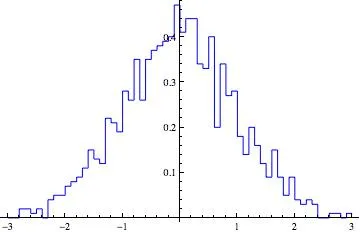
你可以根据需要将其扩展为接受任何选项,而不仅仅是"PDF"选项,并且适用于您希望自动选择箱子的情况。 我不喜欢自动分箱,因为我喜欢控制我的箱子宽度和范围,以实现可预测性并轻松与其他图形进行比较。
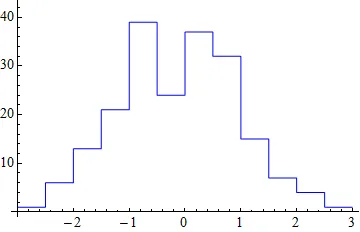
以下是两种在版本7中使用后处理的方法:
rdat = RandomReal[NormalDistribution[0, 1], 200];
MapAt[
  {Blue,
   Line[# /. {{Rectangle[{x_, y_}, {X_, Y_}]}} :> Sequence[{x, Y}, {X, Y}]] } &,
  Histogram[rdat, PerformanceGoal -> "Speed"],
  {1, 2, 2, 2}
]
Cases[
  Histogram[rdat, PerformanceGoal -> "Speed"],
  Rectangle[{x_, y_}, {X_, Y_}] :> {{x, Y}, {X, Y}},
  \[Infinity]
];

Graphics[Line[Join @@ %], AspectRatio -> 1/GoldenRatio, Axes -> True]
Histogram已经发生了变化。 - user616736
BinCounts(需要一些额外的工作)来实现。 - Szabolcs