Mathematica:直方图中不需要的垂直线

3

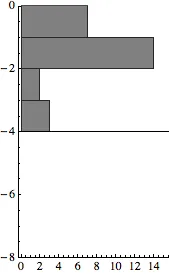
当将直方图的图形范围从自动更改为超过自动计算的图形范围时,Mathematica会绘制一条不需要的水平线,我无法摆脱它(请参见值为-4的右侧直方图)。有人对此问题有建议吗?

我正在Mac OS 10.7.2上运行Mathematica V.8.0.1.0。
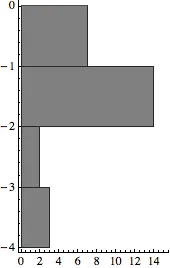
In[1099]:=

data = {-1.2056, -1.46192, -1.30053, -2.52879, -0.99636, -1.73904, -1.164,
-1.83398,-0.97505, -0.503256, -0.63802, -0.785963, -0.711821, -0.820439, -1.8699,
-3.9659, -1.4456, -1.67021, -1.42009, -2.5644, -1.45002, -1.27806, -1.66529,
-1.67073, -3.31102, -3.38638};

HistogramLeft=Histogram[data, PlotRange -> Automatic]

HistogramRight=Histogram[data, PlotRange -> {-8, 0}]

automatic plot range individual plot range


2
展示引起问题的完整代码总是更好的。Brett Champion 正确指出,你展示的图形不是你在问题中粘贴的代码的产物。 - vikkor
抱歉 Viktor Korbel。我完全忘记了我为我的直方图设置了个别选项。这就是为什么我的帖子中缺少一些信息的原因。 - John
3个回答

3

看起来你正在使用 Frame -> {{True, False}, {True, False}}(或类似的东西)。如果是这种情况,你可以使用 Axes->False 完全关闭正常轴。


谢谢Brett Champion!你是对的:我使用了Frame -> {{True, False}, {True, False}}。加上Axes->False就可以了!再次感谢! - John
2
根据文档,将“Frame”设置为除“False”以外的任何值都应该默认关闭绘制轴。然而,它从来没有按照这种方式工作过。它最终会这样吗? - rcollyer

2

请看AxesOrigin选项。

HistogramRight =  Histogram[data, PlotRange -> {-8, 0}, BarOrigin -> Left,  AxesOrigin -> {-8, 0}]

0
如果我理解你的意思,这应该很容易,我想。
试试看。
HistogramRight = 
 Histogram[data, PlotRange -> {-8, 0}, BarOrigin -> Left, 
 PlotLabel -> Left, Axes -> {False, True}]

顺便提一下,现在有一个新的Mathematica堆栈交换平台https://mathematica.stackexchange.com/

网页内容由stack overflow 提供, 点击上面的
可以查看英文原文,
原文链接