我想用一个带有箱线图的小提琴图来绘制沿两个维度分布的图形。结果可以非常迷人,但只有在正确操作时才能实现。
ToothGrowth$dose <- as.factor(ToothGrowth$dose)
head(ToothGrowth)
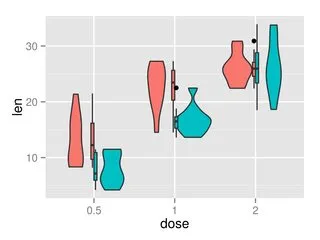
plot <- ggplot(ToothGrowth, aes(x=dose, y=len, fill=supp)) +
geom_violin() + geom_boxplot(width=0.1) + theme(legend.position="none")
ggsave(filename="Violinboxplot.png", plot, height=6, width=4)
这是我得到的结果: