我已经修改了vioplot函数,使其可以接受列表作为输入,你可以使用这个vioplot2函数:
vioplot2<-function (x, ..., range = 1.5, h = NULL, ylim = NULL, names = NULL,
    horizontal = FALSE, col = "magenta", border = "black", lty = 1,
    lwd = 1, rectCol = "black", colMed = "white", pchMed = 19,
    at, add = FALSE, wex = 1, drawRect = TRUE)
{
    if(!is.list(x)){
        datas <- list(x, ...)
    } else{
        datas<-x
    }
    n <- length(datas)
    if (missing(at))
        at <- 1:n
    upper <- vector(mode = "numeric", length = n)
    lower <- vector(mode = "numeric", length = n)
    q1 <- vector(mode = "numeric", length = n)
    q3 <- vector(mode = "numeric", length = n)
    med <- vector(mode = "numeric", length = n)
    base <- vector(mode = "list", length = n)
    height <- vector(mode = "list", length = n)
    baserange <- c(Inf, -Inf)
    args <- list(display = "none")
    if (!(is.null(h)))
        args <- c(args, h = h)
    for (i in 1:n) {
        data <- datas[[i]]
        data.min <- min(data)
        data.max <- max(data)
        q1[i] <- quantile(data, 0.25)
        q3[i] <- quantile(data, 0.75)
        med[i] <- median(data)
        iqd <- q3[i] - q1[i]
        upper[i] <- min(q3[i] + range * iqd, data.max)
        lower[i] <- max(q1[i] - range * iqd, data.min)
        est.xlim <- c(min(lower[i], data.min), max(upper[i],
            data.max))
        smout <- do.call("sm.density", c(list(data, xlim = est.xlim),
            args))
        hscale <- 0.4/max(smout$estimate) * wex
        base[[i]] <- smout$eval.points
        height[[i]] <- smout$estimate * hscale
        t <- range(base[[i]])
        baserange[1] <- min(baserange[1], t[1])
        baserange[2] <- max(baserange[2], t[2])
    }
    if (!add) {
        xlim <- if (n == 1)
            at + c(-0.5, 0.5)
        else range(at) + min(diff(at))/2 * c(-1, 1)
        if (is.null(ylim)) {
            ylim <- baserange
        }
    }
    if (is.null(names)) {
        label <- 1:n
    }
    else {
        label <- names
    }
    boxwidth <- 0.05 * wex
    if (!add)
        plot.new()
    if (!horizontal) {
        if (!add) {
            plot.window(xlim = xlim, ylim = ylim)
            axis(2)
            axis(1, at = at, label = label)
        }
        box()
        for (i in 1:n) {
            polygon(c(at[i] - height[[i]], rev(at[i] + height[[i]])),
                c(base[[i]], rev(base[[i]])), col = col, border = border,
                lty = lty, lwd = lwd)
            if (drawRect) {
                lines(at[c(i, i)], c(lower[i], upper[i]), lwd = lwd,
                  lty = lty)
                rect(at[i] - boxwidth/2, q1[i], at[i] + boxwidth/2,
                  q3[i], col = rectCol)
                points(at[i], med[i], pch = pchMed, col = colMed)
            }
        }
    }
    else {
        if (!add) {
            plot.window(xlim = ylim, ylim = xlim)
            axis(1)
            axis(2, at = at, label = label)
        }
        box()
        for (i in 1:n) {
            polygon(c(base[[i]], rev(base[[i]])), c(at[i] - height[[i]],
                rev(at[i] + height[[i]])), col = col, border = border,
                lty = lty, lwd = lwd)
            if (drawRect) {
                lines(c(lower[i], upper[i]), at[c(i, i)], lwd = lwd,
                  lty = lty)
                rect(q1[i], at[i] - boxwidth/2, q3[i], at[i] +
                  boxwidth/2, col = rectCol)
                points(med[i], at[i], pch = pchMed, col = colMed)
            }
        }
    }
    invisible(list(upper = upper, lower = lower, median = med,
        q1 = q1, q3 = q3))
}
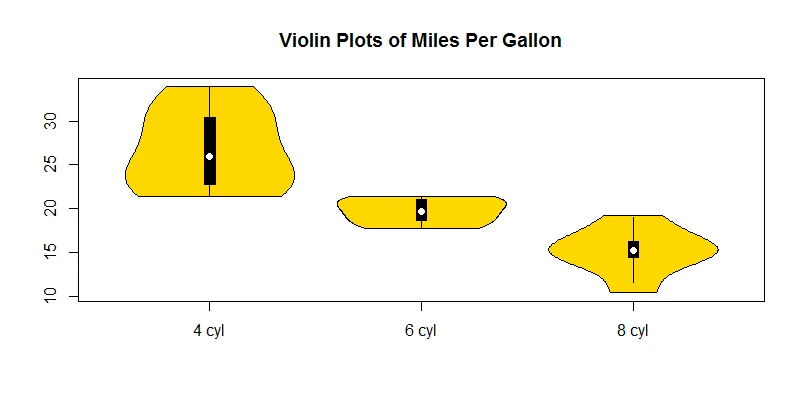
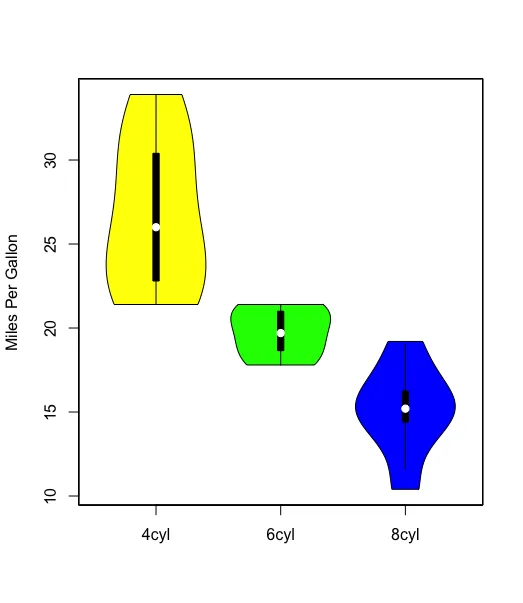
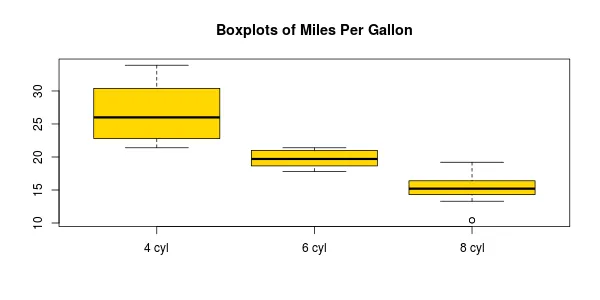
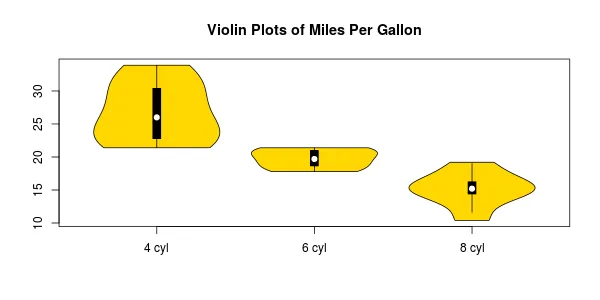
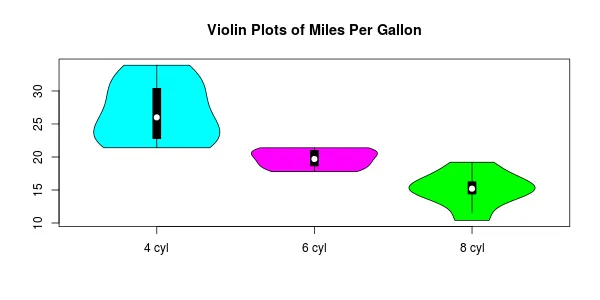
您的示例将得到如下内容:
l的更清晰的定义(绕过首先执行所有x的需要)是l <- split(mtcars, mtcars$cyl)。 - Gregor Thomas