我可以做一些数据列的汇总可视化和统计,相关内容涉及it技术。我想将两个或更多的子图与描述性表格结合起来,并将图保存到本地。但是当保存图时,表格的一部分会被裁剪。
当我执行以下操作时:
产量: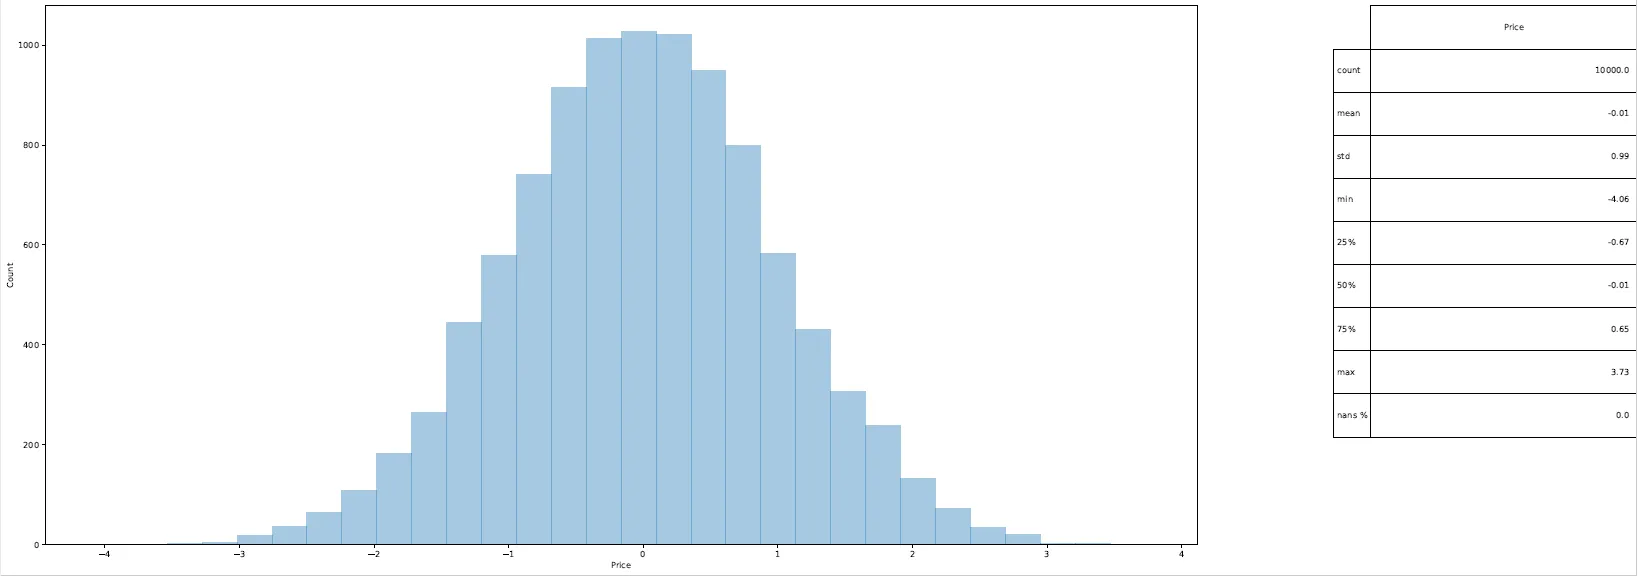 我已经尝试过。
当我执行以下操作时:
import numpy as np
import pandas as pd
import matplotlib.pyplot as plt
import seaborn as sns
column=np.random.normal(size=10000)
df=pd.DataFrame(column, columns=["Price"])
summary = (
df.describe()
.append((df.isnull().sum()/len(df)*100)
.rename('nans %'))
.iloc[:,0].to_frame()
)
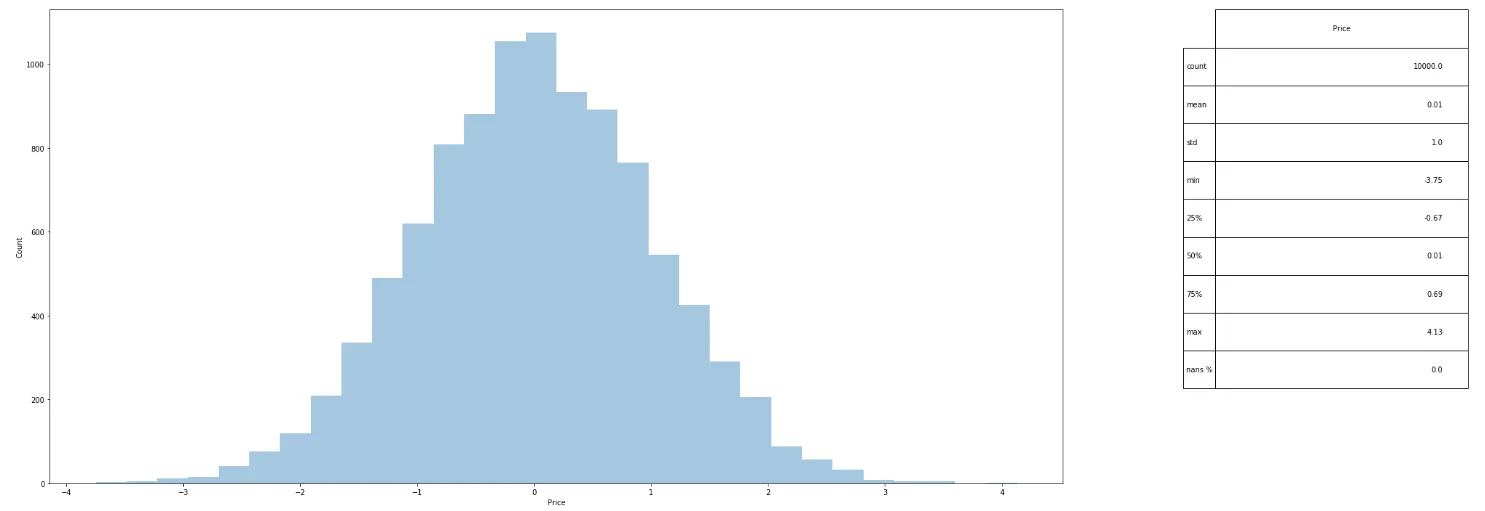
fig, (ax_distplot) = plt.subplots(1, 1, figsize=(25, 12))
#Distplot with summarizing table
sns.distplot(df.loc[:,"Price"], hist=True, bins=30, kde=False, ax=ax_distplot)
ax_distplot.set(ylabel='Count')
tab = ax_distplot.table(cellText=np.around(summary.values, decimals=2),
rowLabels=summary.index,
colLabels=summary.columns, loc="right",
bbox=[1.15, .2, 0.25, 0.8])
我理解到:
使用以下命令将其本地保存时,会得到如下结果:
plt.savefig("Price.pdf", bbox_inches="tight")
产量:
我已经尝试过。plt.subplots_adjust(right=0.85)
没有任何运气。